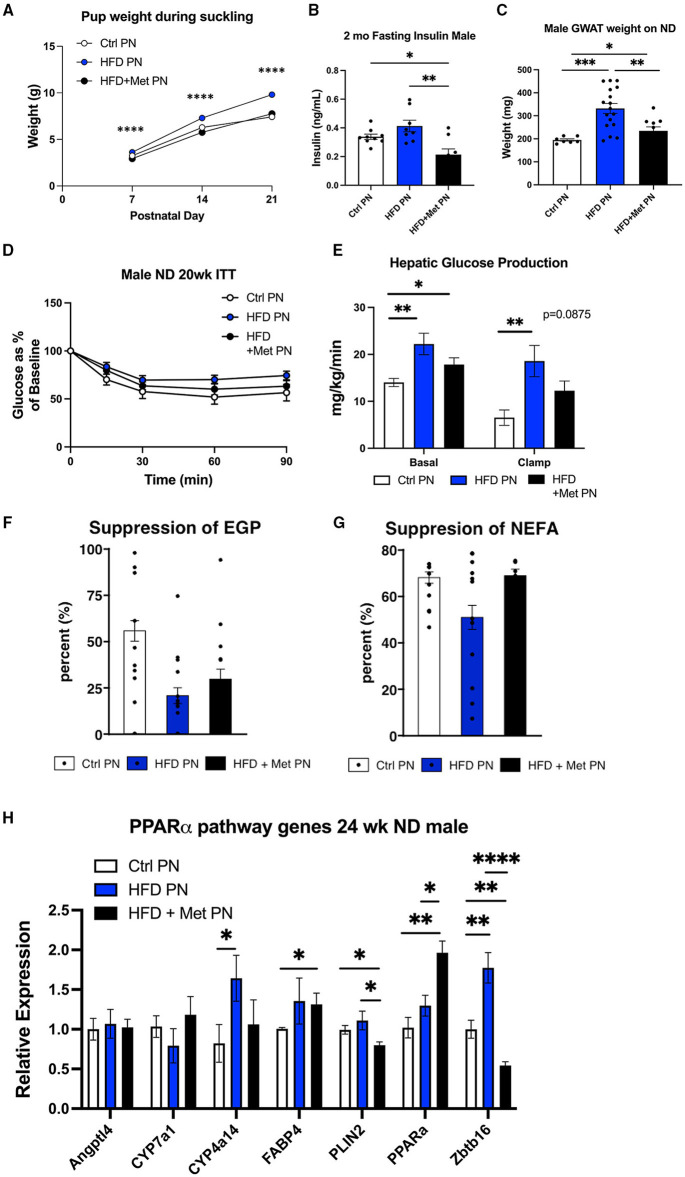
Figure 6.
Impact of metformin given during lactation at the time of HFD exposure on offspring. White values are for Ctrl PN, blue are for HFD PN, and black are for HFD + Met PN offspring (A). Pup weights during lactation averaged by litter (n = 6–7 litters) (B). Fasting insulin in male offspring at 2 months of age (C). Visceral fat pad weight (GWAT) in male offspring at necropsy at 6 months (D). Insulin tolerance test at 5 months (n = 7–8) (E). Hepatic glucose production at basal and clamped conditions during the hyperinsulin mice uglycemic clamp (HEC). This is the same clamp as in Figure 3 in which Ctrl PN and HFD PN results were shown, repeated here with the addition of the HFD + Met PN group (n = 8–11) (F). Percent suppression of endogenous glucose production (G). Percent suppression of lipolysis on clamp (H). PPAR-alpha pathway genes in adult male offspring-fed ND at 6 months (n = 5–8). Ctrl PN and HFDPN expression results were previously shown in Figure 5D, repeated here with the addition of the HFD + Met PN group. Ctrl, control; HFD, high-fat diet; PN, post-natal; Met, metformin. *p < 0.05, **p < 0.01, ***p < 0.001, ****p < 0.0001.

