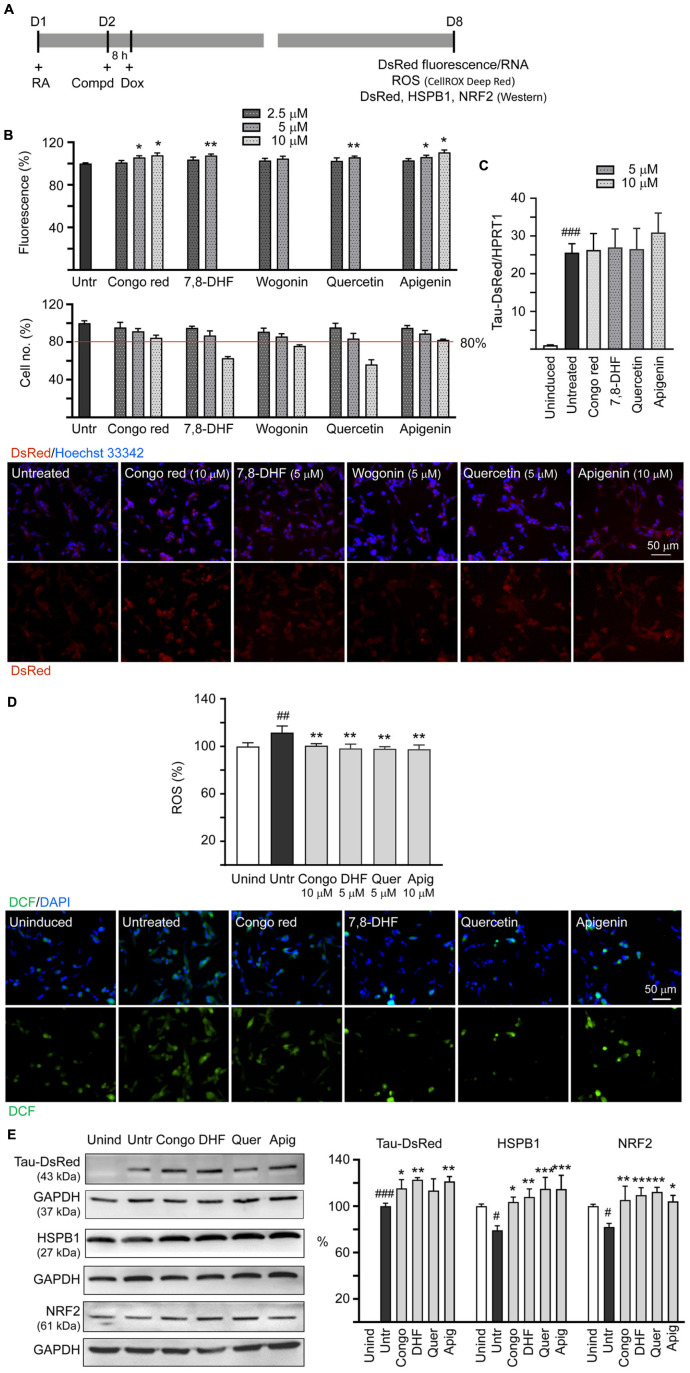
FIGURE 3.
Tau aggregation inhibition and reactive oxygen species (ROS) reduction in SH-SY5Y cells expressing ΔK280 TauRD-DsRed. (A) Experimental flowchart. On day 1, cells were plated with retinoic acid (RA) (10 μM) added to the culture medium. On day 2, Congo red (as a positive control), 7,8-DHF, wogonin, quercetin, or apigenin was added to the cells for 8 h, followed by inducing ΔK280 TauRD-DsRed expression with doxycycline (Dox) (2 μg/ml) for 6 days. On day 8, ΔK280 TauRD-DsRed fluorescence/RNA, ROS dichlorofluorescein (DCF stain), as well as DsRed, heat shock protein family B (small) member 1 (HSPB1), and nuclear factor erythroid 2-like 2 (NRF2) protein levels were measured. (B) Top: Assessment of DsRed fluorescence with Congo red, 7,8-DHF, wogonin, quercetin, or apigenin (2.5–10 μM) treatment and cell number (obtained by counting Hoechst 33342 stained cell nuclei) analyzed (n = 3). The relative DsRed fluorescence/cell number of untreated cells (Untr) was normalized as 100%. p-values: comparisons between with and without compound addition (*p < 0.05, **p < 0.01; two-tailed Student’s t-test). Bottom: Fluorescent images of ΔK280 TauRD-DsRed cells with or without Congo red (10 μM), 7,8-DHF (5 μM), wogonin (5 μM), quercetin (5 μM), or apigenin (10 μM) treatment. Nuclei were counterstained with Hoechst 33342 (blue). (C) Real-time PCR analysis of TauRD-DsRed RNA in SH-SY5Y cells uninduced, untreated, or treated with 5 or 10 μM compound (n = 3). HPRT1 was used as an endogenous control to normalize between samples. (D) Top: Quantitation of ROS (n = 3) and images of DCF stain (green) of ΔK280 TauRD-DsRed cells uninduced, untreated, or treated with Congo red (10 μM), 7,8-DHF (5 μM), quercetin (5 μM), or apigenin (10 μM). The relative ROS of uninduced cells was normalized as 100%. Bottom: Images of DCF (green) assay of ΔK280 TauRD-DsRed cells uninduced, untreated, or treated with Congo red (10 μM), 7,8-DHF (5 μM), quercetin (5 μM), or apigenin (10 μM). Nuclei were counterstained with 4′,6-diamidino-2-phenylindole (DAPI) (blue). (E) Immunoblot analysis of TauRD-DsRed, HSPB1, and NRF2 proteins in SH-SY5Y cells uninduced, untreated, or treated with 5 or 10 μM compound (n = 3). Glyceraldehyde-3-phosphate dehydrogenase (GAPDH) was used as a loading control. To normalize, the HSPB1 or NRF2 expression level in uninduced (Unind) cells was set at 100%. For TauRD-DsRed, the soluble level in untreated cells (Untr) cells was set at 100%. (D,E) p-values: comparisons between untreated vs. uninduced cells (#p < 0.05, ##p < 0.01, ###p < 0.001) or compound-treated vs. untreated cells (*p < 0.05, **p < 0.01, ***p < 0.001) (one-way ANOVA with the post hoc Tukey’s test).

