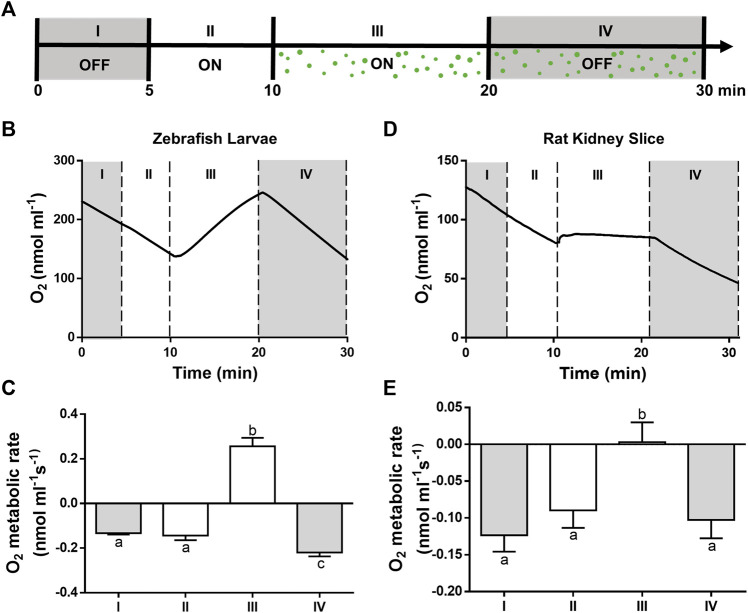
FIGURE 4.
Oxygenation capacity of the photosynthetic solution. Oxygen concentrations were measured for 5 min in darkness (I, OFF) or light (II, ON). Then, microalgae were incorporated and measurements were performed for 10 min in the presence (III, ON) or absence (IV, OFF) of light (A). In the absence of light or microalgae (I, II and IV) a negative slope of the curve was seen for both, zebrafish larvae (B,C) and kidney slices (D,E), while in the presence of light and microalgae, the slope became positive for the larvae and nearly flat for the slices. A representative curve is shown for each experiment (B–D) and their metabolic rates calculated from the slopes (C–E). Data are expressed as mean ± SD; N = 3; different letters in C and E indicate significant differences with p < 0.05 (one-way ANOVA followed by Tukey´s test).

