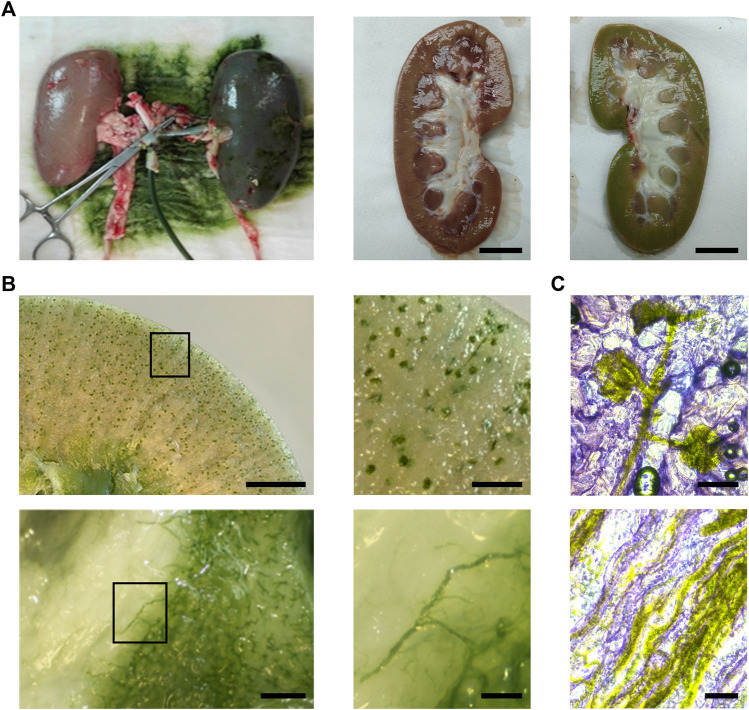
FIGURE 5.
Distribution of the photosynthetic solution in porcine kidney. Compared to controls, organs turned green after perfusion [(A), left and right]. Fresh slices show a vascular distribution of the solution in the renal cortex [(B), top] and medulla [(B), bottom]. Cryosections of perfused kidneys show the distribution of C. reinhardtii in glomeruli and afferent arteriole [(C), top] and medullar blood vessels and capillaries [(C), bottom]. Scale bar represents 2 cm in A, 5 mm in (B) (top, left), 1 mm in (B) (top, right) and (B) (bottom, left), 250 µm in (B) (bottom, right), 100 µm in (C).

