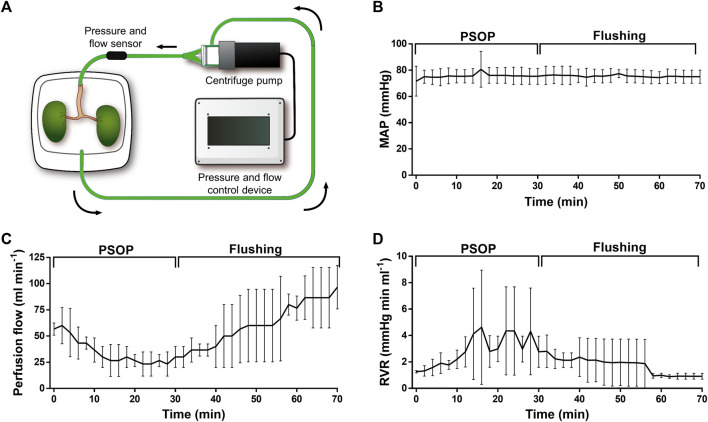
FIGURE 6.
Dynamic perfusion of isolated porcine kidneys. Schematic representation of the ex vivo perfusion system, containing a pressure-flow controlling device, a centrifuge pump, and a container for the isolated organs (A). Vascular parameters were measured during the photosynthetic perfusion and the subsequent flushing step. Mean arterial pressure (MAP) was set to 70–80 mmHg remaining stable during the entire procedure (B). Perfusion flow decreased during the PSOP perfusion (C), while renal vascular resistance (RVR) increased, recovering during the flushing step (D). Data are expressed as mean ± SEM; N = 3 in (B–D).

