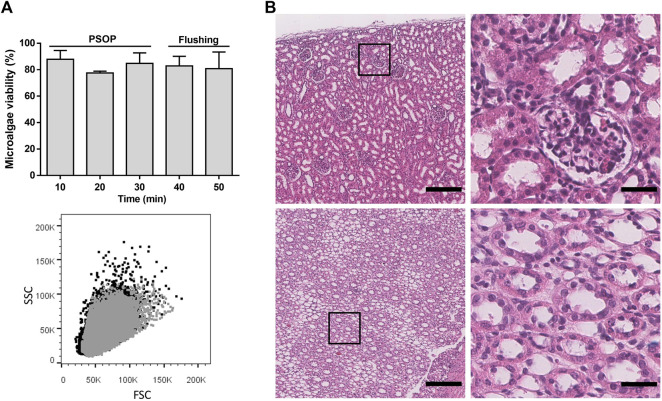
FIGURE 7.
Microalgae viability and renal tissue integrity after dynamic photosynthetic perfusion. Viability [(A), upper] and morphology [(A), lower] of the microalgae were not affected by the perfusion and the subsequent flushing step. H&E-stained paraffin sections, shows a normal histological structure of porcine kidneys in cortex [(B); top] and medulla [(B); bottom] after perfusion. Black and grey dots in A (bottom) indicate microalgae samples of the solution obtained before and after 10 min of perfusion, respectively, showing an almost complete overlapping of the signal where gray dots masked the microalgae population represented by black dots. Scale bar represents 200 µm [(B), left] and 30 µm [(B), right]. Data are expressed as mean ± SD; N = 2 in A.

