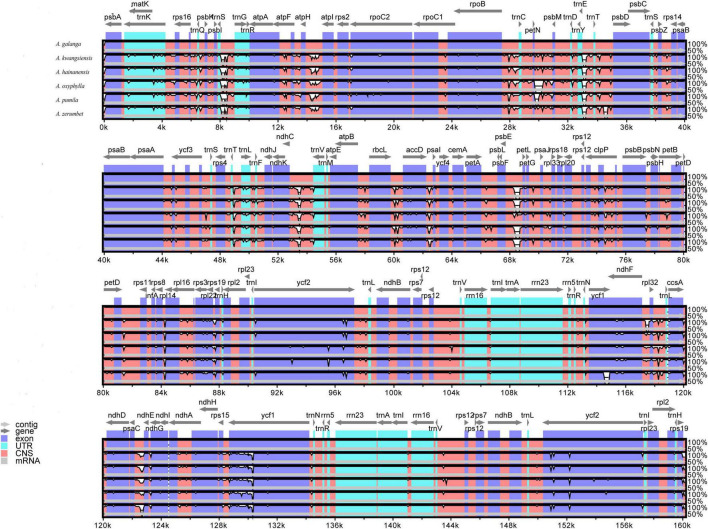
FIGURE 4.
Structural comparison of the complete CP genomes of six Alpinia species using mVISTA. The CP genome of A. galanga was used as a reference. Gray arrows and thick black lines above the alignments indicate gene orientations and the positions of IRs in the genes, respectively. White peaks represent differences among CP genomes. A similarity cut-off value of 70% was used for the plots, and the Y-axis represents the percentage similarity (50–100%).

