Figure 4.

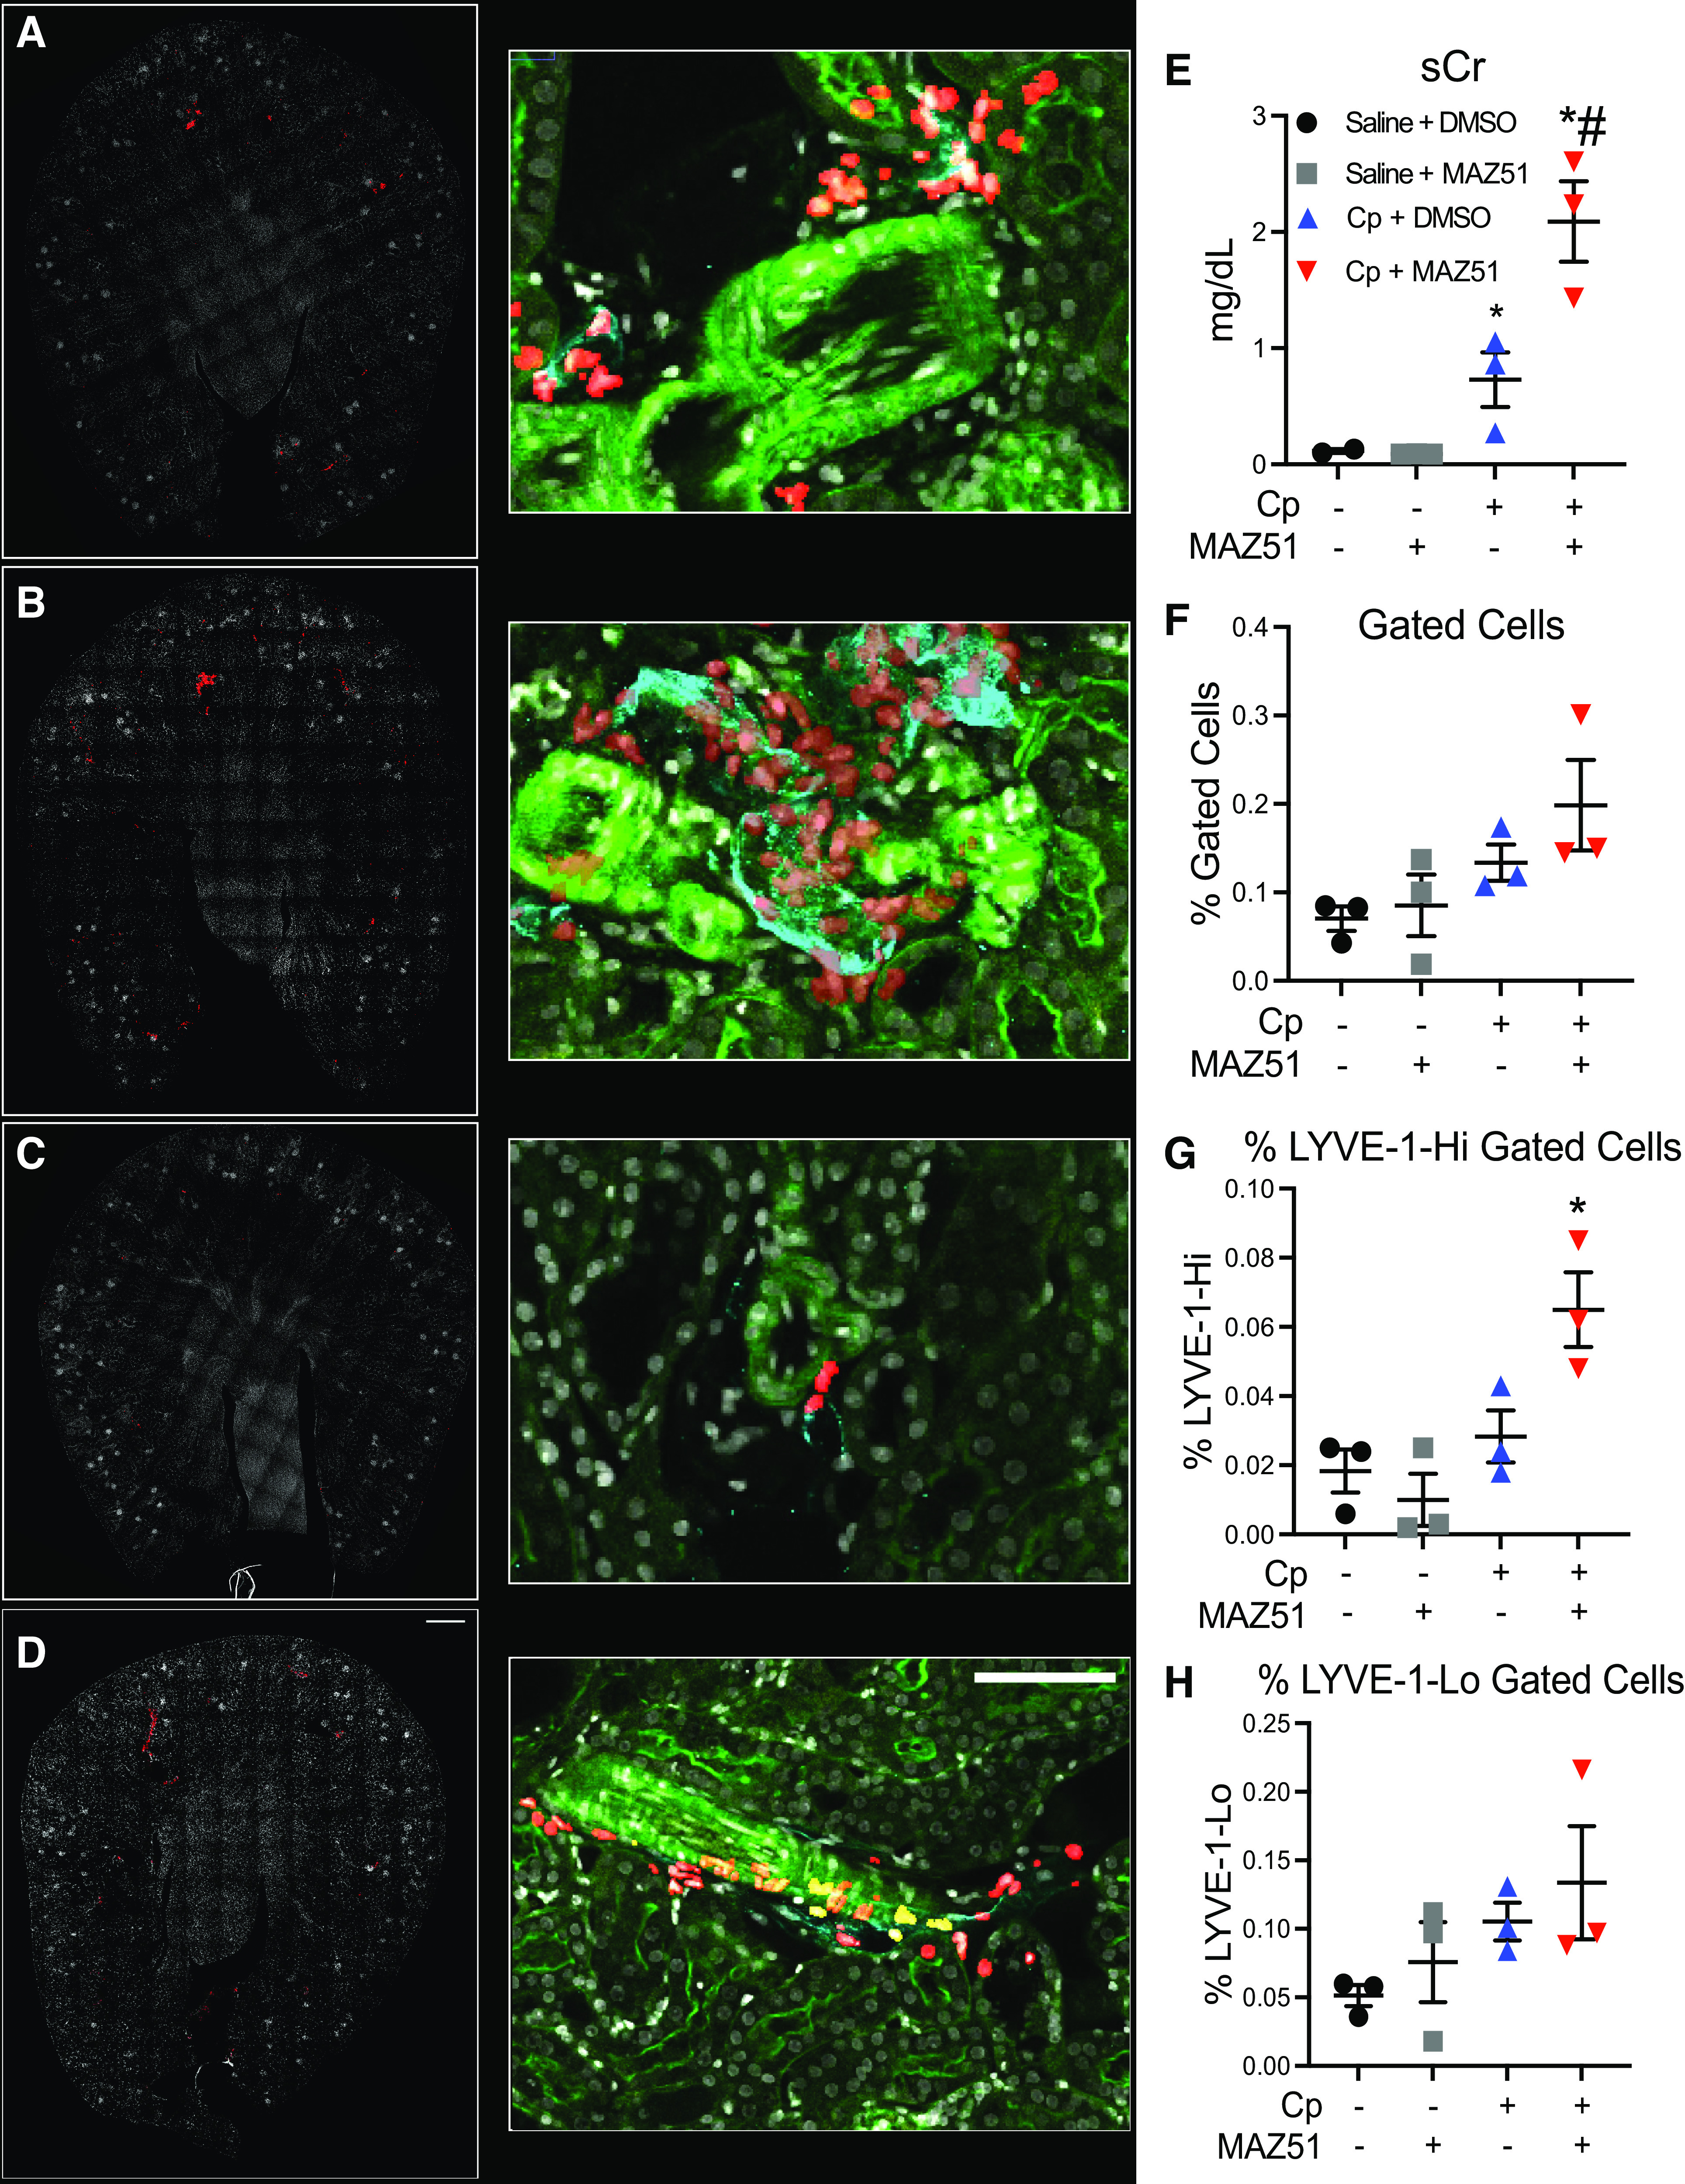
Three-dimensional confocal fluorescence microscopy and cytometry of lymphatic vessel hyaluronan receptor-1 (LYVE-1)-positive lymphatic vessels. Maximum projection of composite fluorescence images of whole kidney sections (left; scale bar = 500 µm) and high-magnification insets (middle; scale bar = 100 µm) from saline + DMSO-treated (A), cisplatin (Cp) + DMSO-treated (B), saline + MAZ51-treated (C), and Cp + MAZ51-treated (D) animals at day 3. In the left images, DAPI is shown in white and nuclei of LYVE-1-positive cells are shown in red. In the middle images, DAPI is shown in white, LYVE-1 is shown in cyan, filamentous actin is shown in green, and gated LYVE-1-positive nuclei are shown in red. E: serum creatinine (sCr) levels were measured and expressed as mg/dL at day 3. Scatterplots with percentages of total LYVE-1-positive cells (F), LYVE-1-Hi (G), and LYVE-1-Lo (H) gated cells. Quantifications obtained from Volumetric Tissue Exploration and Analysis were plotted, showing percentages out of the total number of cells. Data are expressed as means ± SE; n = 3 animals per group. *P < 0.05 vs. vehicle control; #P < 0.05 vs. Cp + DMSO using one-way ANOVA followed by a Tukey’s multiple comparisons test.
