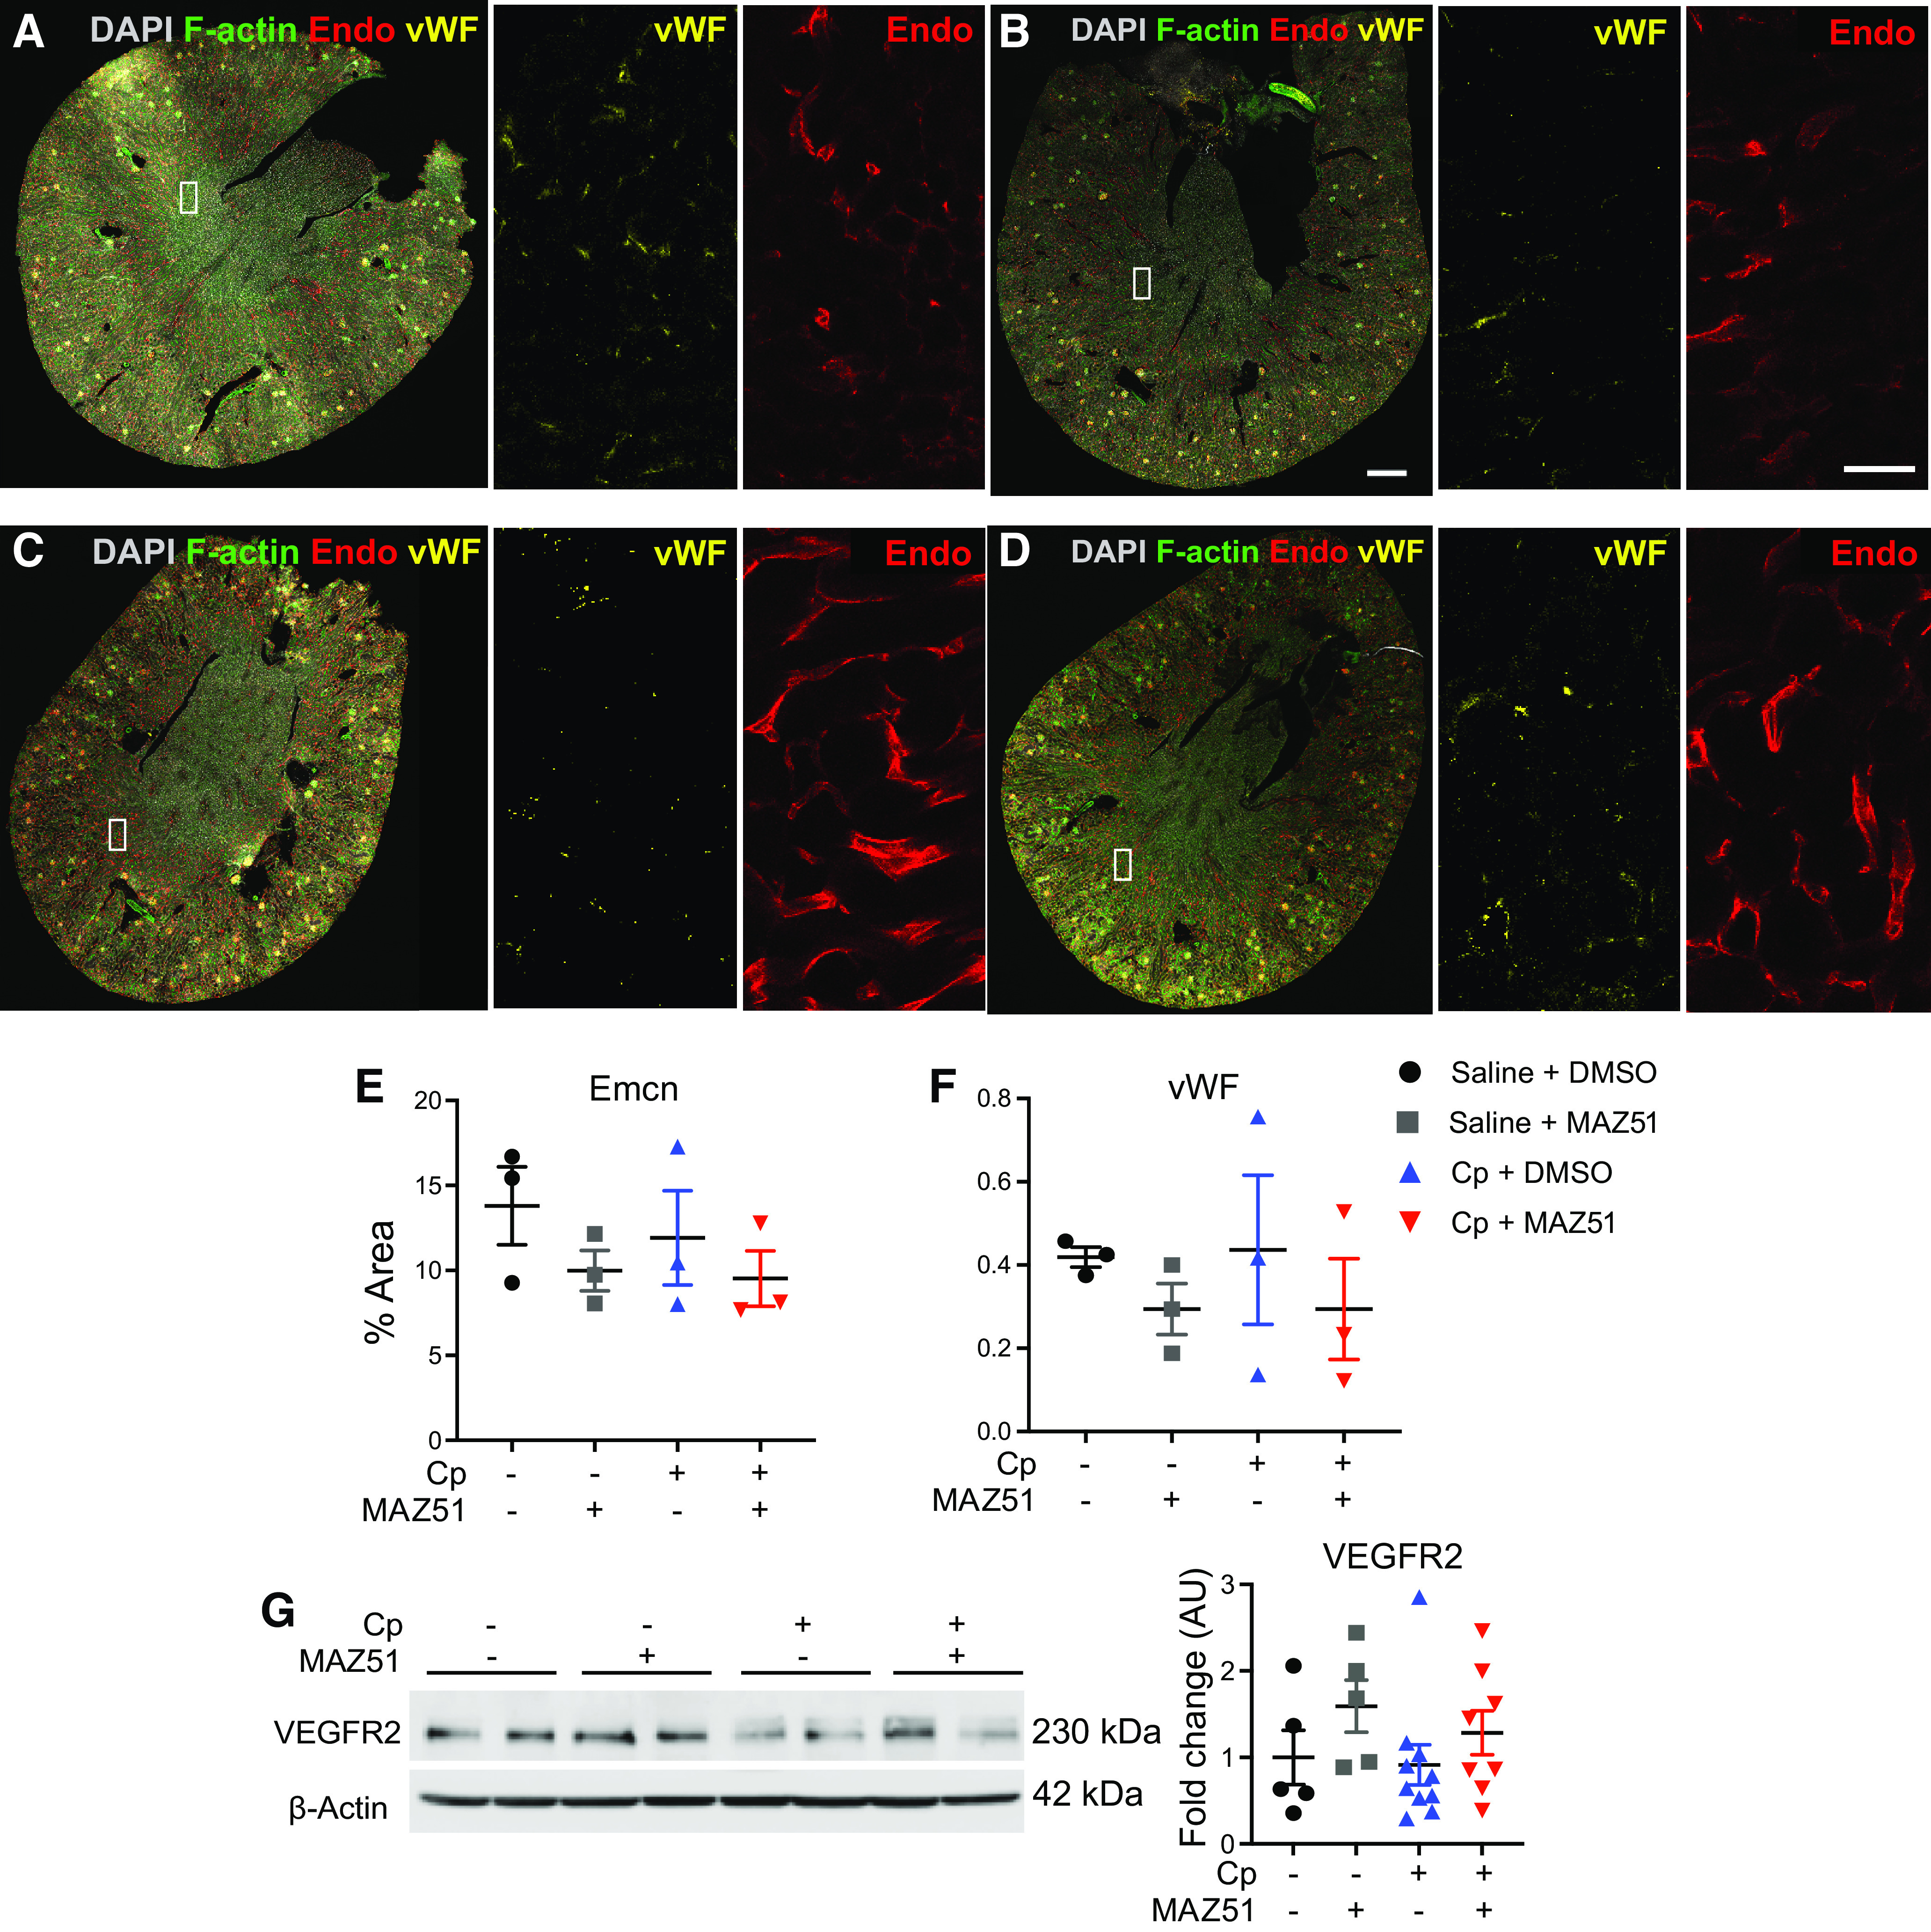
Figure 6.

Visualization and analysis of endomucin (Emcn)-positive and von Willebrand factor (vWF)-positive cells. Large-scale three-dimensional imaging of saline + DMSO-treated (A), saline + MAZ51-treated (B), cisplatin (Cp) + DMSO-treated (C), and Cp + MAZ51-treated (D) animals at day 3. The white rectangles correspond to the two insets with Emcn (E) or wWF (F) alone. Scale bars = 500 µm in B and 50 µm in B, right inset. Quantification of the immunofluorescent area corresponding to Emcn-positive (E) and vWF (F)-positive cells. G: Western blot analysis of vascular endothelial growth factor receptor 2 (VEGFR2) expression levels. Anti-β-actin was used as a loading control. Densitometric values were calculated and expressed in arbitrary units (AU). Data are expressed as means ± SE; n = 5–10 animals per group.
