Figure 1.

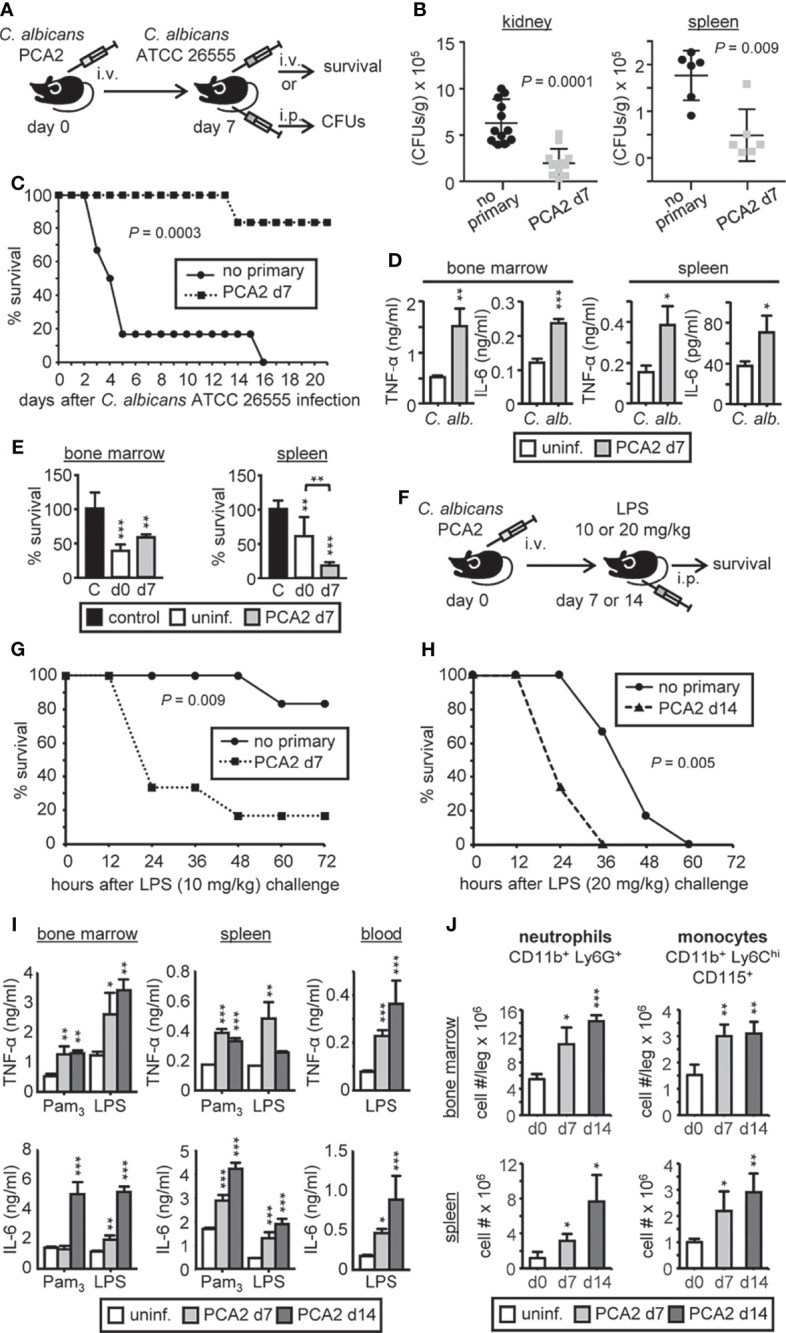
C. albicans PCA2 infection induces a trained response for proinflammatory cytokine production. (A) PCA2 vaccination animal model, 1.5 million PCA2 yeasts were i.v. injected into mice and 7 days later mice were reinfected with a lethal dose of the virulent strain ATCC 26555, either i.p. with 30 million of yeasts to measure CFUs in the kidneys and the spleen 4 days later, or i.v. with 1.5 million of yeast to assess survival. (B) Fungal burden in the kidneys and spleen expressed as CFUs per gram of tissue (n = 6-12). (C) Mice survival percentage (n = 8). (D) Same number of total RBC-lysed bone marrow cells or splenocytes were cultured and stimulated with inactivated yeasts of C. albicans for 24h and TNF-α and IL-6 levels were assessed by ELISA in supernatants. (E) Fungicidal activity determination by total RBC-lysed bone marrow cells or splenocytes, challenged with viable PCA2 yeasts at a 25:1 or 50:1 ratio respectively (murine cell:yeast) for 3 h C. albicans cells in culture medium without murine cells (control). CFUs were counted from diluted samples plated on Sabouraud dextrose agar and killing percentages were determined as: % killing = [1 – (CFUs sample at t = 3 h)/(CFUs control at t = 3 h)] × 100. (F) Septic shock model induced by an i.p. injection of LPS to mice 7 or 14 days after the PCA2 infection. (G) Mice survival percentage of 7-day PCA2-induced septic shock (n = 6). (H) Mice survival percentage of 14-day PCA2-induced septic shock (n = 6). (I) Same number of total RBC-lysed bone marrow cells or splenocytes, or equal volumes of blood, were cultured and stimulated with Pam3CSK4 or LPS for 24h and TNF-α and IL-6 levels were assessed by ELISA in supernatants. (J) neutrophils and monocytes cell numbers in bone marrow and spleen were assessed by flow cytometry at the indicated time points post-PCA2 infection. For the in vitro assays triplicate samples were analyzed, results are expressed as means plus SD of one representative experiment of at least 3 independent experiments, and statistical significance was assessed by Student’s t test (*P < 0.05, **P < 0.01, and ***P < 0.001) and for survival curves by Gehan-Breslow-Wilcoxon test. See also Supplementary Figure 1 .
