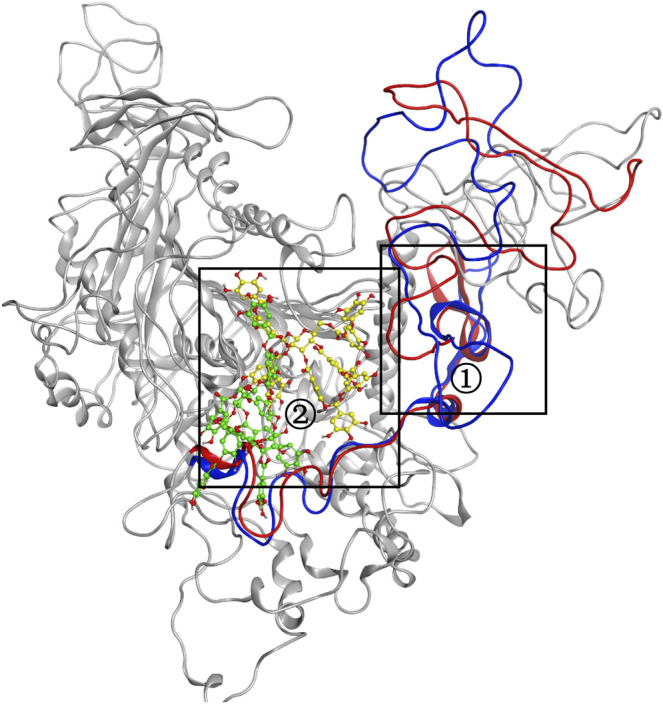
FIGURE 8.

The conformational change for the complex of TanALb and tannic acid. Loops 341–450 of 0 -s simulation structure are shown in blue, and the ligand is shown in green. Meanwhile, loops 341–450 of 500-ns simulation structure are shown in red, and the ligand is shown in yellow.
