FIGURE 7.
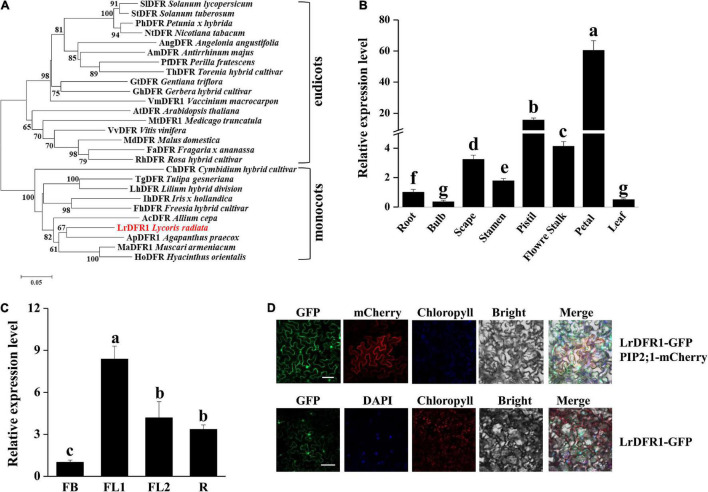
Phylogenetic tree analysis, transcription expression profiles, and subcellular localization of LrDFR1. (A) Phylogenetic assessment of LrDFR1 with other DFR proteins from different plants. Phylogenetic tree generation was achieved using the maximum likelihood method in MEGA 7.0 software. Numbers at every interior branch show bootstrap values of 1000 replicates. The bar shows a 0.05 genetic distance. Plant species as well as GenBank accession numbers of DFR proteins used in phylogenetic analyses are: Solanum tuberosum StDFR (AF449422), Solanum lycopersicum SlDFR (CAA79154.1), Petunia hybrida PhDFR (AF233639), Angelonia angustifolia AngDFR (KJ817183), Nicotiana tabacum NtDFR (NP_001312559.1), Antirrhinum majus AmDFR (X15536), Perilla frutescens PfDFR (AB002817), Gentiana triflora GtDFR (D85185), Torenia hybrid ThDFR (AB012924), Gerbera hybrid GhDFR (Z17221), Vaccinium macrocarpon VmDFR1 (AF483835), Arabidopsis thaliana AtDFR (AB033294), Medicago truncatula MtDFR1 (AY389346), Vitis vinifera VvDFR (Y11749), Malus domestica MdDFR (AAO39816), Rosa hybrid RhDFR (D85102), Cymbidium hybrid ChDFR (AF017451), Fragaria ananassa FaDFR (AF029685), Tulipa gesneriana TgDFR (BAH98155.1), Lilium hybrid LhDFR (AB058641), Iris hollandica IhDFR (BAF93856.1), Allium cepa AcDFR (AY221250.2), Agapanthus praecox ApDFR (AB099529.1), Muscari aucheri MaDFR (MH636605), Freesia hybrid FhDFR (KU132389), and Hyacinthus orientalis HoDFR (AFP58815.1). (B) Expression profiles of LrDFR1 in various tissues of L. radiata. Expressions of LrDFR1 were assessed by qRT-PCR, and normalized to LrTIP41. Expressions of LrDFR1 in root tissues were defined as 1.0. Data are shown as mean ± SD. Bars with different letters are significantly different at p < 0.05 according to Duncan’s multiple range test. (C) Expression profiles of LrDFR1 during the FB stage, FL1 stage, FL2 stage and R stage of L. radiata. Expression levels of LrDFR1 were assessed by qRT-PCR, and normalized to LrTIP41. Expression levels of LrDFR1 in FB stage were defined as 1.0. Data are shown as mean ± SD. Bars with different letters are significantly different at p < 0.05 according to Duncan’s multiple range test. (D) Subcellular localization of LrDFR1 in N. benthamiana epidermal cells. Scale bars = 20 μm. The nuclei are indicated by DAPI staining.

