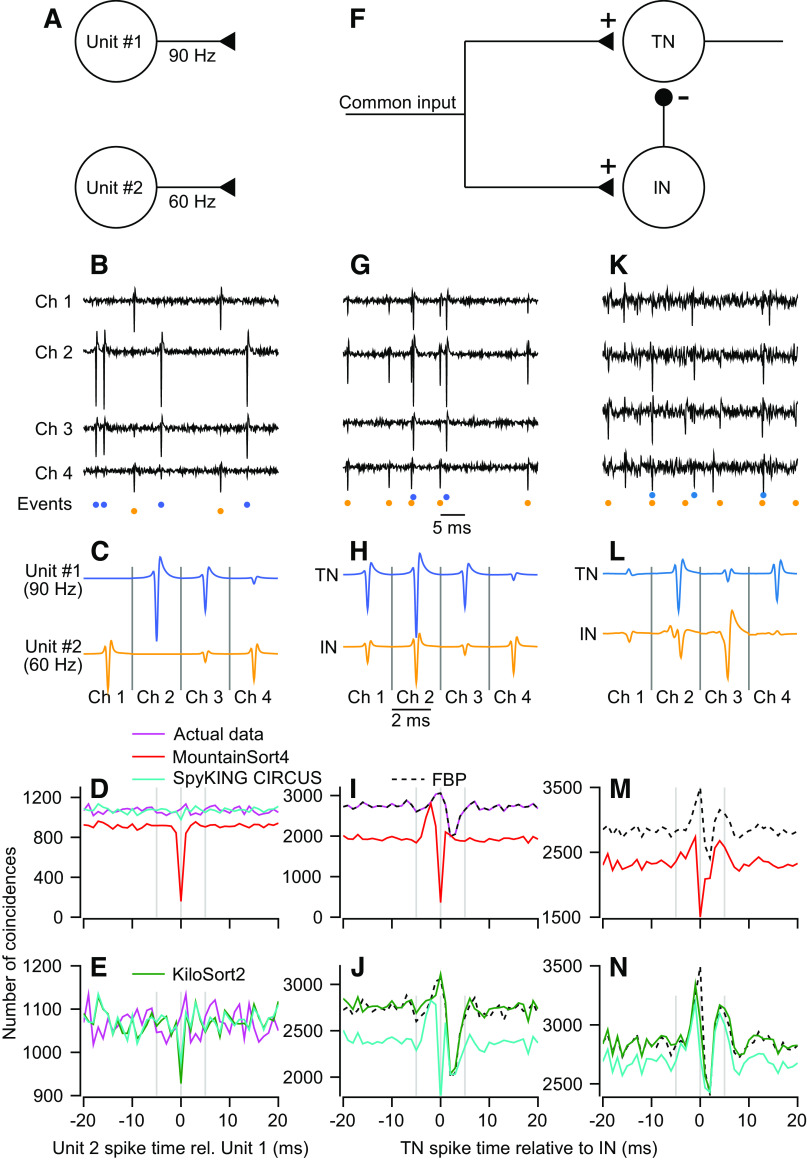
Figure 4.
Sorting accuracy for overlapping spikes in synthetic and real data. A: simulated network of two independent units with Poisson firing rates. B: sample voltage trace from synthetic data set generated from the templates in C. Colored symbols below the traces indicate time points where templates in C were added to noise that was partially correlated across channels. D and E: magenta trace shows the cross-correlogram (CCG) for the synthetic data. Other traces show CCGs between the top 2 units for each sorter. Full binary pursuit (FBP) output was identical to the actual data and is not shown for clarity. F: simulated feedforward inhibition circuit. The inhibitory neuron (IN) inhibits the target neuron (TN). G–J: same as B–E with spike times taken from the feedforward inhibition circuit. K: sample voltage traces from four channels of data from the cerebellar cortex. Colored symbols below the traces show the event times discovered by FBP. L: average templates of two units discovered by FBP. M and N: dashed black trace shows the CCG between the two FBP output units. Other traces show the CCG for the two closest matching units from the other sorters.

