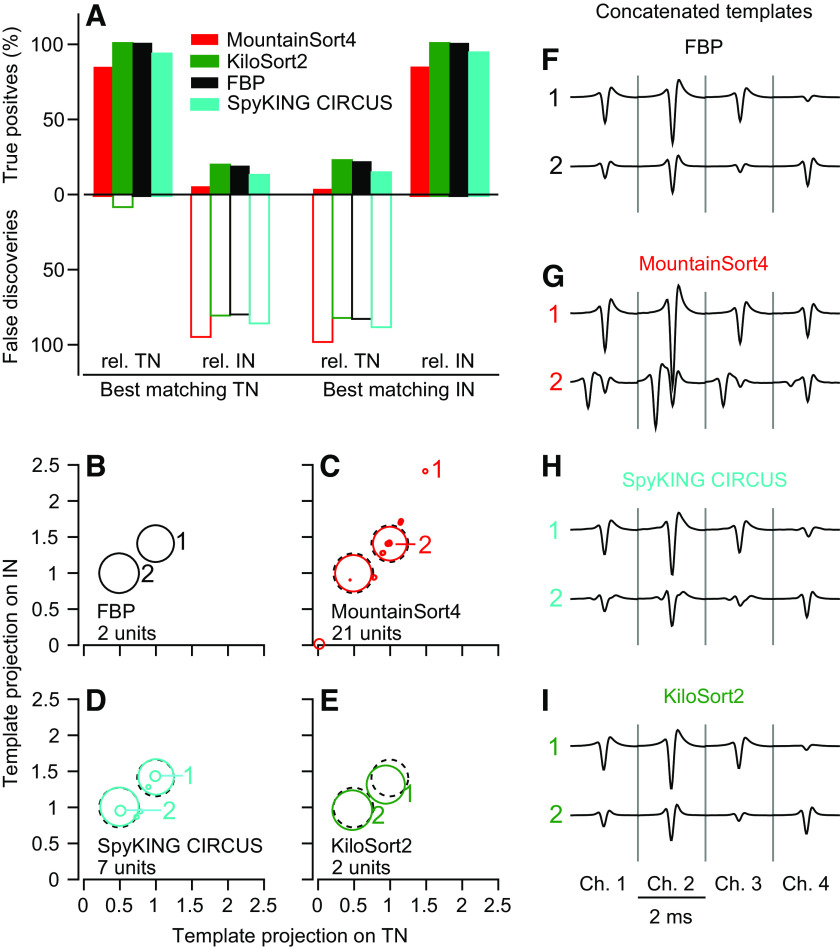
Figure 5.
Quantitative analysis of sorting accuracy. A: histograms showing true positive (TP) and false discovery (FD) rates for all 4 sorters for synthetic feedforward-inhibition data set from Fig. 4. Different colors indicate results for different sorters. The left two groups of bars vs. the right two groups of bars show results for the sorted unit best matching the true target neuron (TN) and the true inhibitory neuron (IN), respectively. Within each group, TP and FD rates are computed against the real TN spike times (“rel TN”) and the real IN spike times (“rel IN”). B–E: scatterplots showing the projection of each unit’s template against the true TN and true IN templates for each sorter. The area within each symbol is linearly related to the number of spikes discovered in each unit. Dashed circles indicate the projections of the true TN and IN templates, which overlapped perfectly with the projections for full binary pursuit (FBP) and therefore do not appear in B. F–I: templates for 2 example units discovered by each sorter as labeled with “1” and “2” in B–E.

