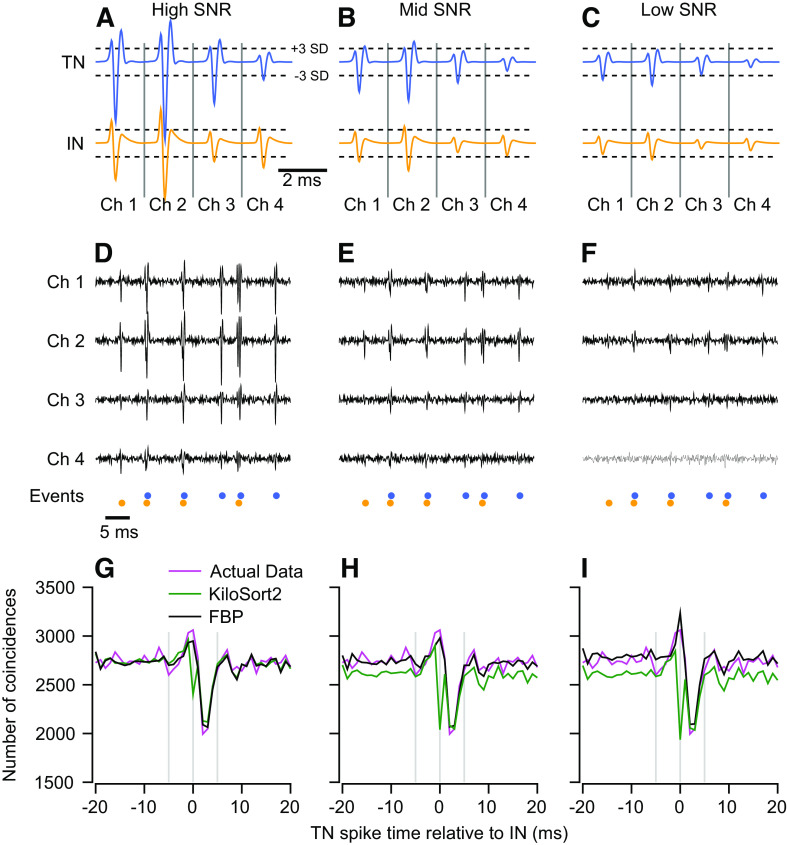
Figure 6.
Sorter performance as signal-to-noise (SNR) ratio degrades. A–C: templates used to generate the synthetic spike trains. Dashed horizontal lines indicate 3 standard deviations of the noise used to create the synthetic data. D–F: example synthetic voltage traces for each value of SNR. Spike event times are the same in each panel and were taken from the synthetic feedforward inhibition data set of Fig. 4, F–J. G–I: magenta, green, and black traces show cross-correlograms (CCGs) constructed by plotting the distribution of the spike times for the best matching target neuron (TN) unit relative to the time of the best matching inhibitory neuron (IN) spike for the synthetic data, KiloSort2, and full binary pursuit (FBP). Values of true positive (TP) and false discovery (FD) in each graph are for the TN and IN, in that order.

