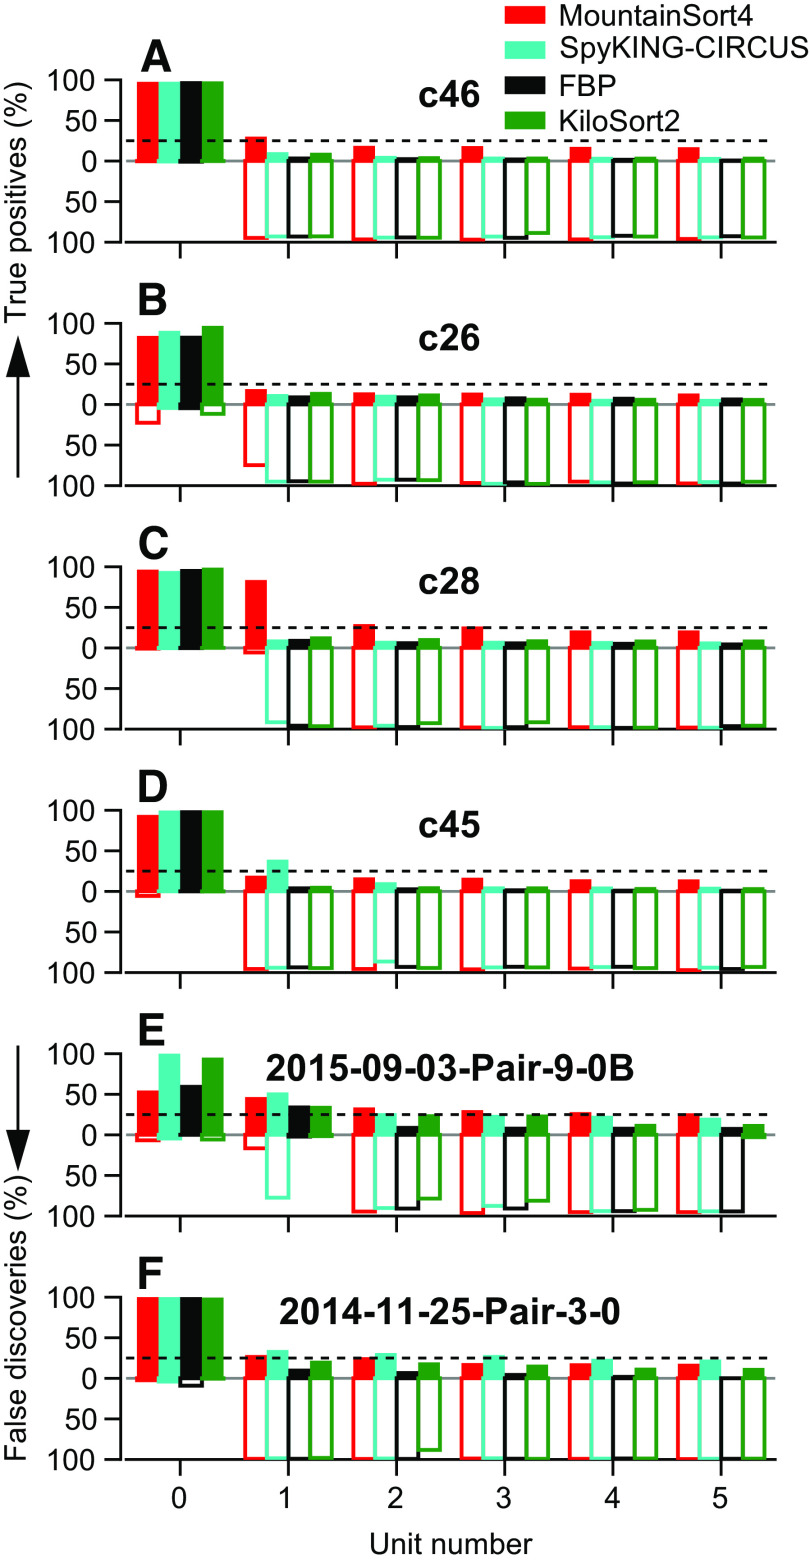
Figure 8.
Quantitative assessment of spike sorter accuracy for 6 files of the SpikeForest Kampff data set. Each graph presents data for a different recording and plots the true positive (TP) and false discovery (FD) rates for the 6 units with the highest TP detections of the ground-truth unit ordered by TP rate. Bars above the abscissa (filled) show TP rates, those below the abscissa (unfilled) show FD rates. Data are shown for each of the 4 sorters tested. Full binary pursuit (FBP), black; SpyKING-CIRCUS, cyan; MountainSort4, red; KiloSort2, green. Horizontal dashed line indicates 25% true positives as an arbitrary reference point. The signal-to-noise ratio (SNR) and maximum SNR channel (see materials and methods) for each recording are: file c46, 5.25 on channel 17 (A); c26, 3.67 on channel 16 (B); c28, 6.70 on channel 16 (C); c45, 5.65 on channel 16 (D); 2015-09-03-Pair-9-0B, 12.50 on channel 9 (E); 2014-11-25-Pair-3-0, 10.50 on channel 3 (F).

