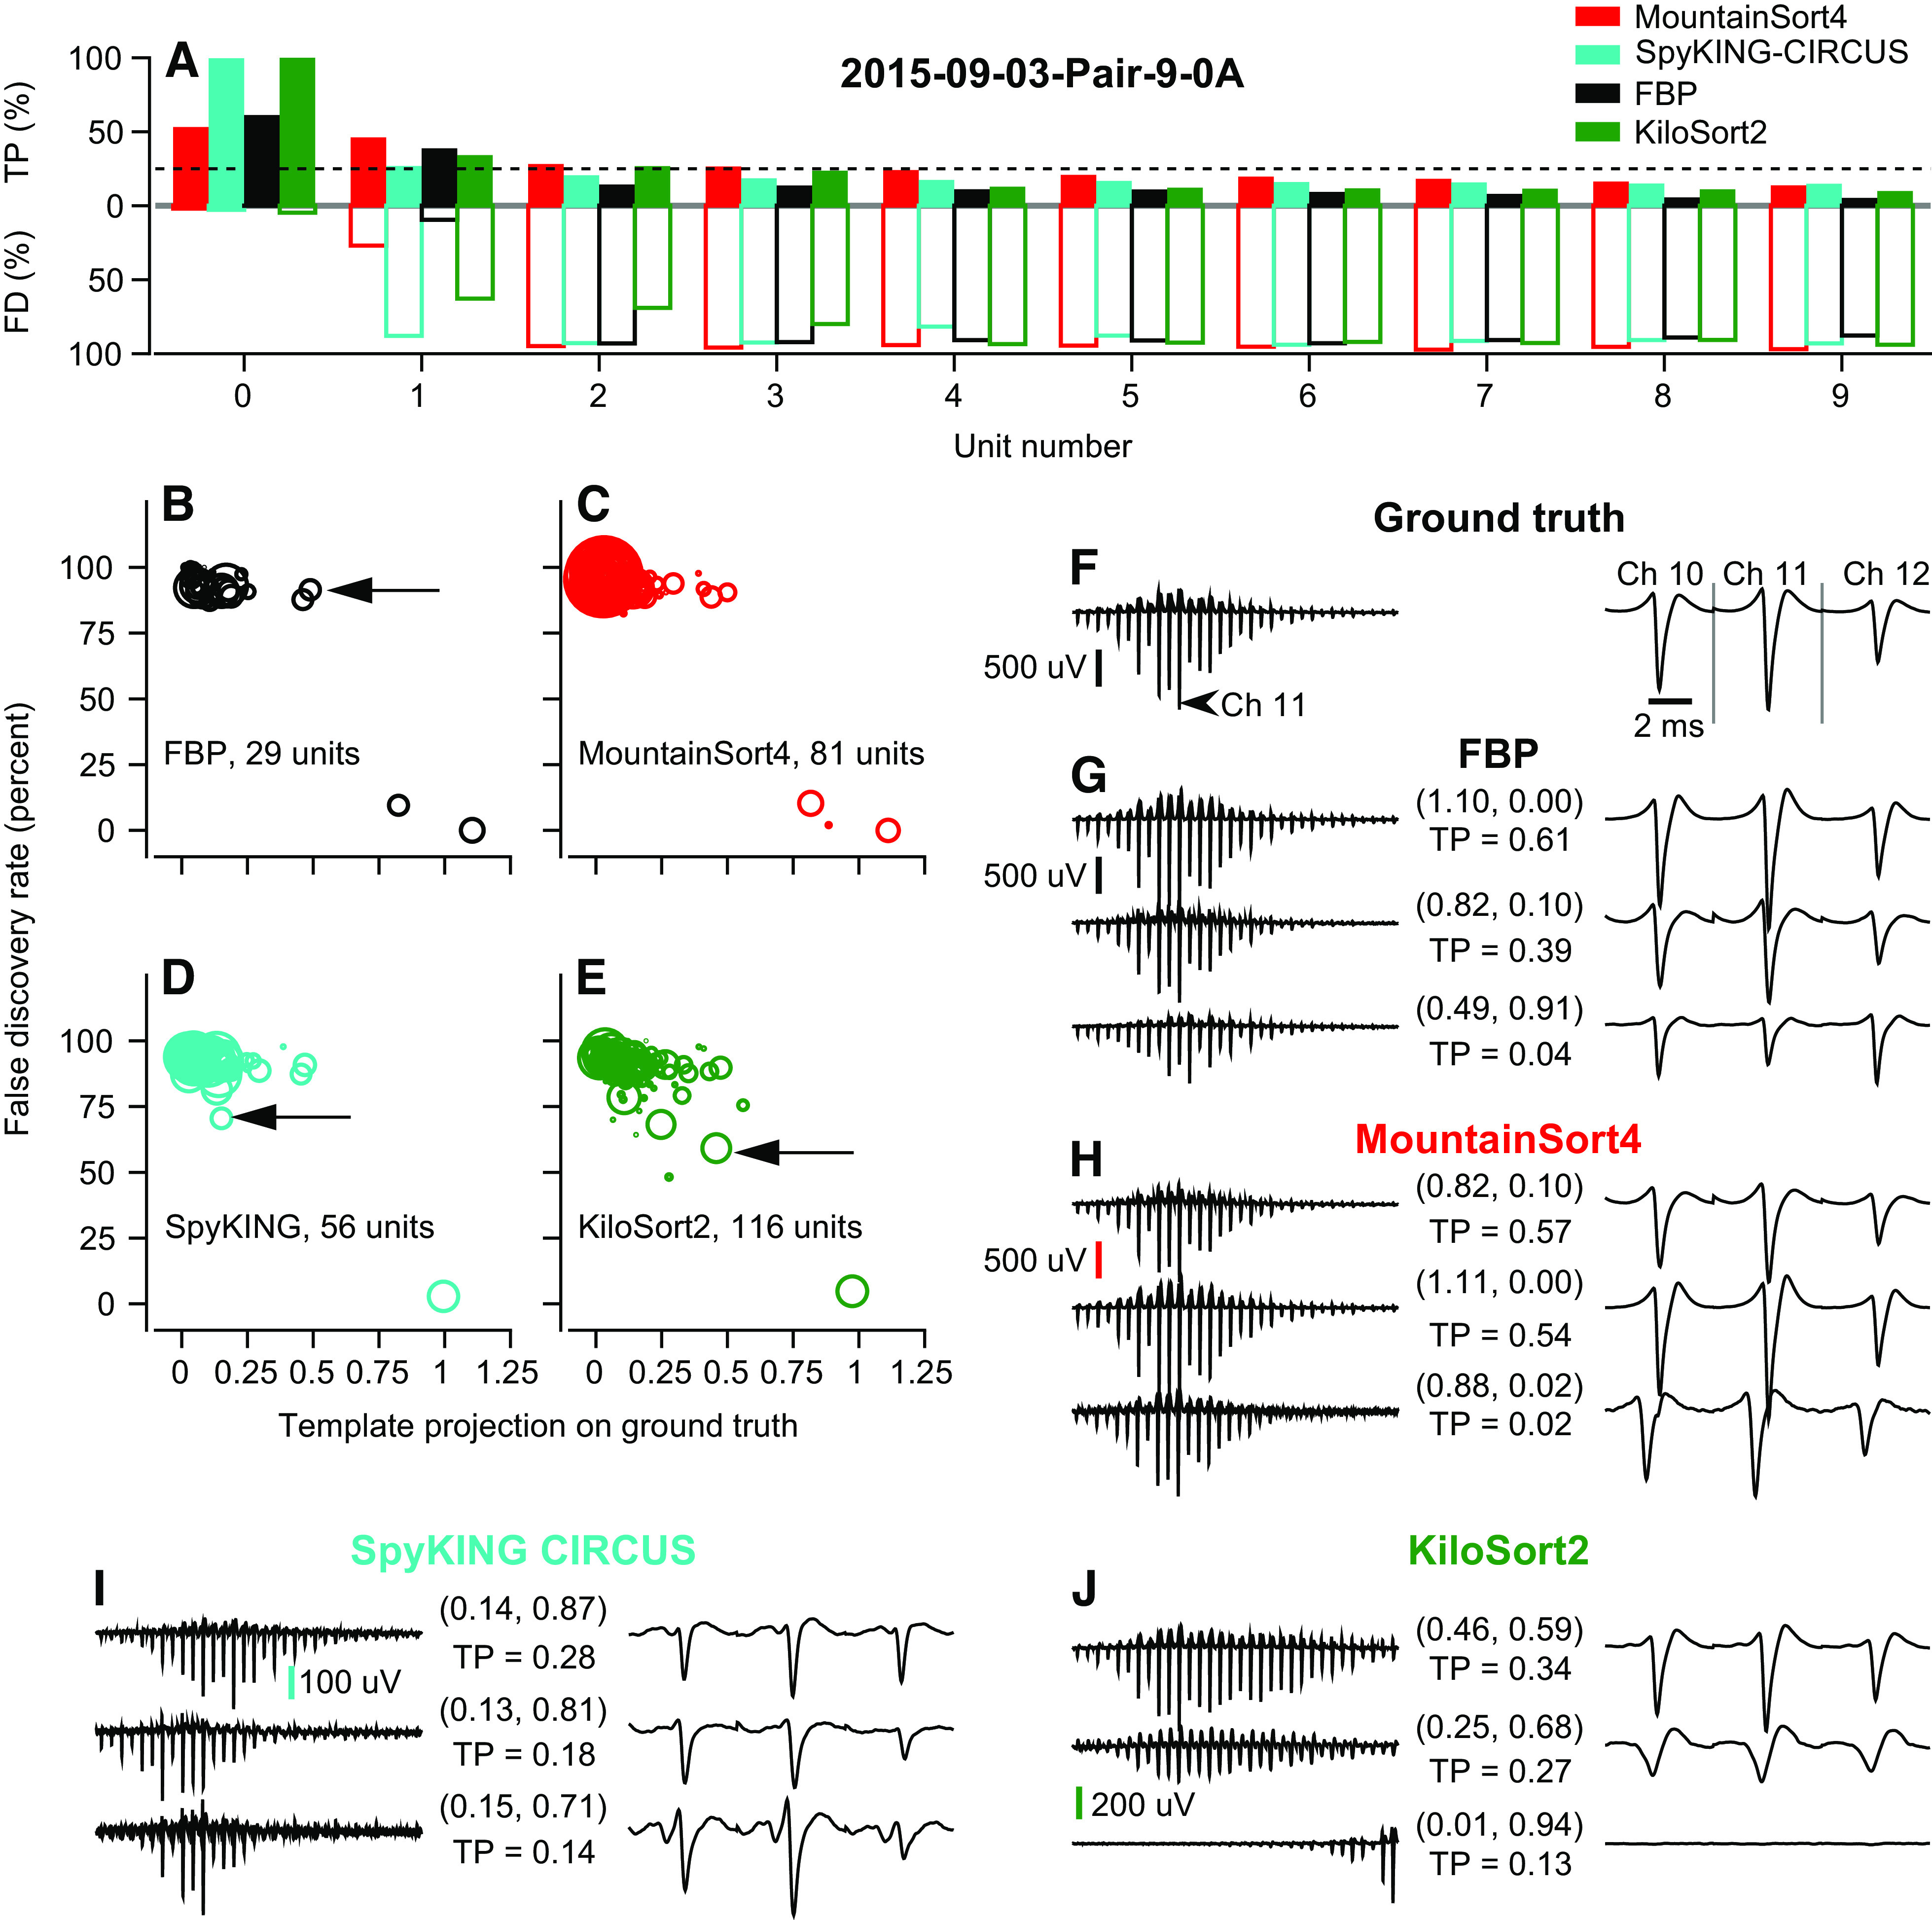
Figure 9.

Detailed assessment of spike sorter performance on ground-truth data from the SpikeForest Kampff 2015-09-03-Pair-9-0A data set. A: the true positive (TP) and false discovery (FD) rates for the 4 spike sorters. Conventions are the same as Fig. 8. B–E: scatterplots of FD rate vs. normalized template projection on the ground-truth template for all units found by each sorter. The actual ground-truth unit would plot at (1, 0). Arrows point to symbols for the units that show evidence of greatest spike sorter error. The area within each symbol is linearly related to the number of spikes discovered for its corresponding unit. F–J: three example templates from each sorter. The best matching templates for both SpyKING CIRCUS and KiloSort2 plot at the points (1.0, 0.03) and (0.97, 0.05), respectively. Both templates are nearly identical to the ground-truth template and are not shown for clarity. In the left column, the templates include all 32 channels in the data set. In the right column, the templates show the same data for 3 channels centered on the channel with greatest signal-to-noise ratio (SNR) for the ground-truth unit. In G–J, each pair of traces has numbers in parenthesis above the traces that give that unit’s coordinates in scatterplots in B–E and numbers below the traces that give the TP rate. The ground-truth SNR is 10.00 on channel 11. FBP, full binary pursuit.
