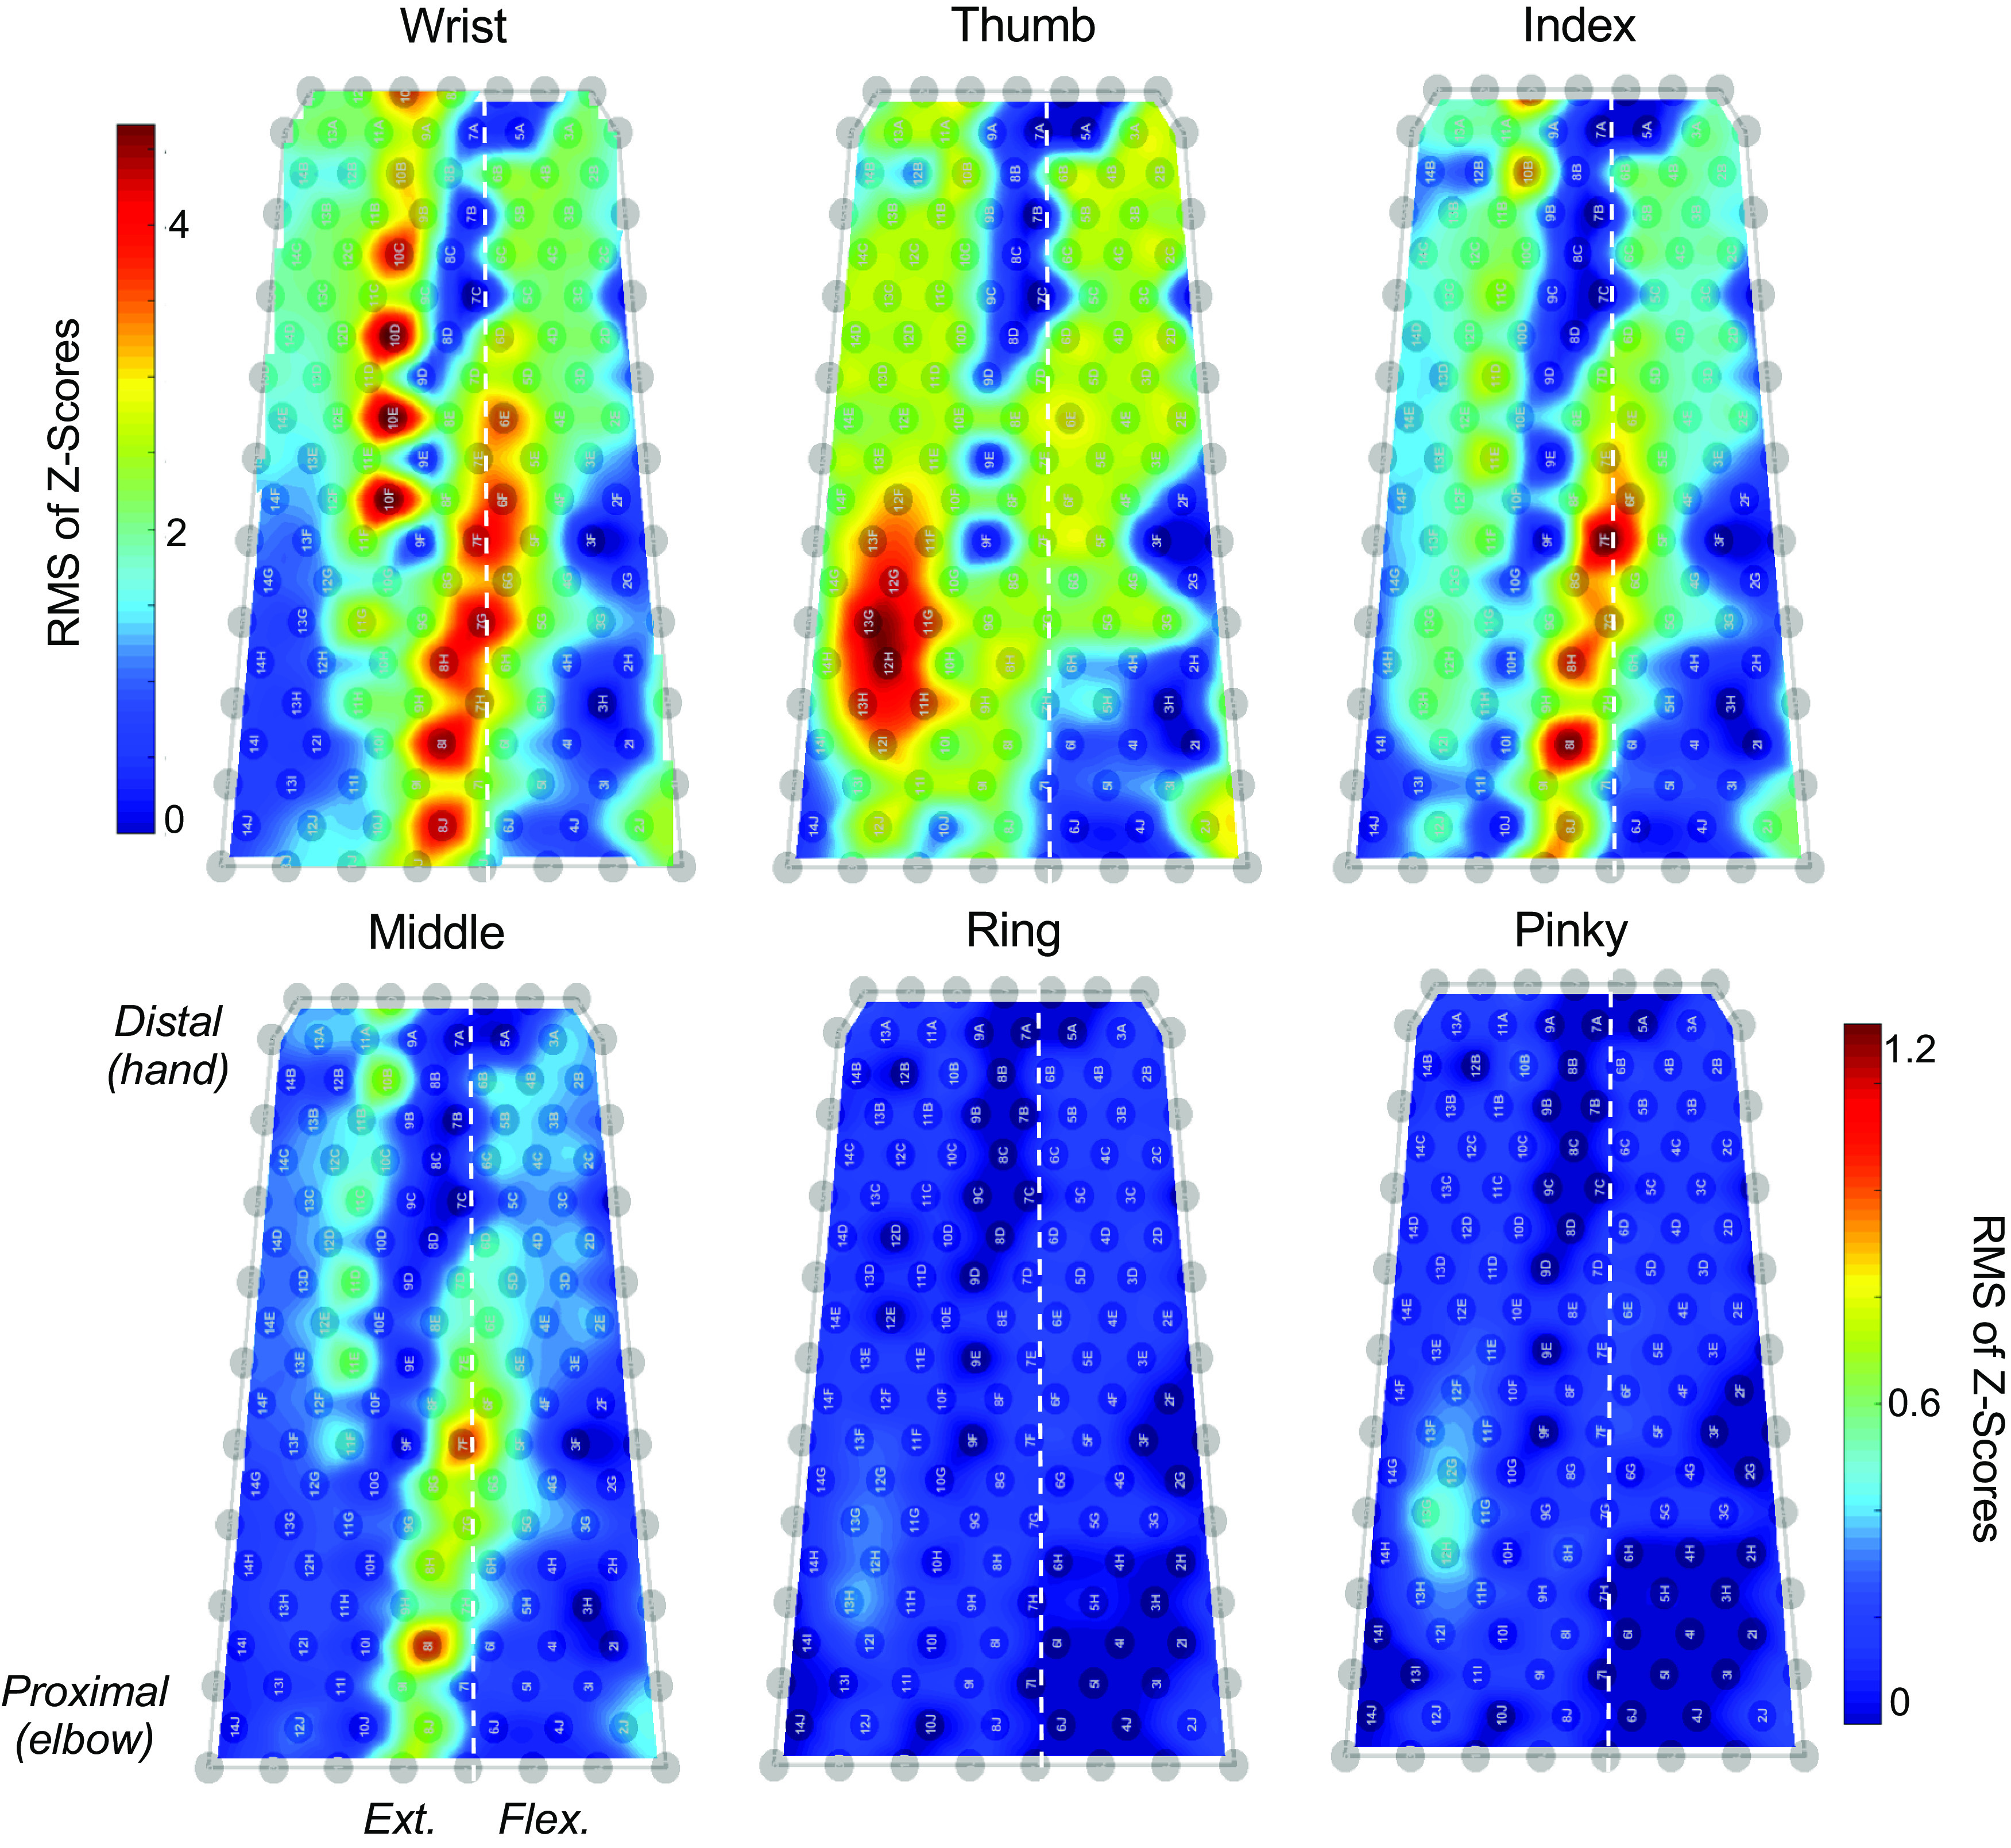
Figure 2.

Amplitude maps of monopolar electromyogram (EMG) power during overt and attempted flexion-extension movements. EMG power during the movement block was measured as the root-mean-square (RMS) of the band-pass-filtered and z-score transformed (generating a zero-mean signal with a standard deviation of 1) EMG for each electrode (gray circles) in the sleeve array. The color bar in the top row corresponds to the amplitude map for the wrist, and the color bar in the bottom row represents the scale for the single digit amplitude maps. The left and right edges of the amplitude map correspond to the border between the dorsal and ventral sides of the forearm on the ulnar side. The vertical dashed line in each plot represents the approximate location of the border between the dorsal and ventral sides on the radial side of the forearm. The extensor and flexor muscle groups are located to the left and right of the dashed line, respectively.
