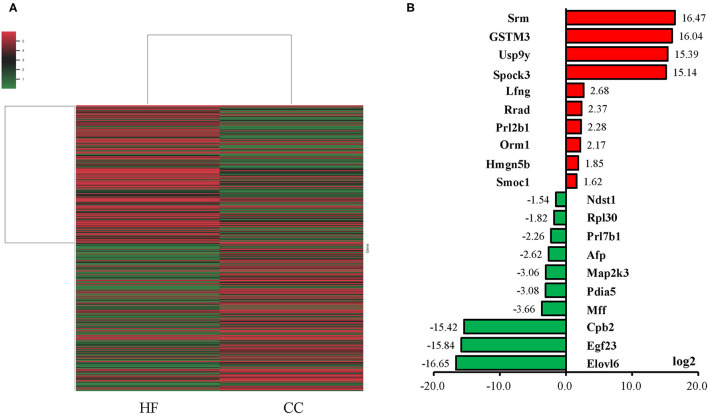
Figure 4.
Gene expression of placental tissue in control diet (CC) group and high-fat diet (HF) group. (A) Heat map of mRNA expression determined using next-generation sequencing (NGS). The heat map lane represents the top 100 expressed mRNAs. Higher and lower intensities are indicated in red and green, respectively. Among the gene expressions with a 1.5-fold difference, the top 10 mRNAs expressed in the HF (red bar) and CC groups are indicated on the bar chart (B). Expression of mRNAs is presented in terms of relative folds. Srm, spermidine synthase; GSTM3, glutathione S-transferase mu 3; Usp9y, ubiquitin specific peptidase 9, Y-linked; Spock3, SPARC/osteonectin, cwcv and kazal like domains proteoglycan 3; Lfng, LFNG O-fucosylpeptide 3-beta-N-acetylglucosaminyltransferase; Rrad, RRAD, Ras-related glycolysis inhibitor and calcium channel regulator; Prl2b1, prolactin family 2, subfamily b, member 1; Orm1, orosomucoid 1; Hmgn5b, high mobility group nucleosome binding domain 5B; Smoc1, SPARC related modular calcium binding 1; Ndst1, N-deacetylase and N-sulfotransferase 1; Rpl30, ribosomal protein L30; Prl7b1, prolactin family 7, subfamily b, member 1; AfP, alpha-fetoprotein; Map2k3, mitogen activated protein kinase kinase 3; Pdia5, protein disulfide isomerase family A, member 5; Mff, mitochondrial fission factor; Cpb2, carboxypeptidase B2; Egf23, fibroblast growth factor 23; Elovl6, ELOVL fatty acid elongase 6.

