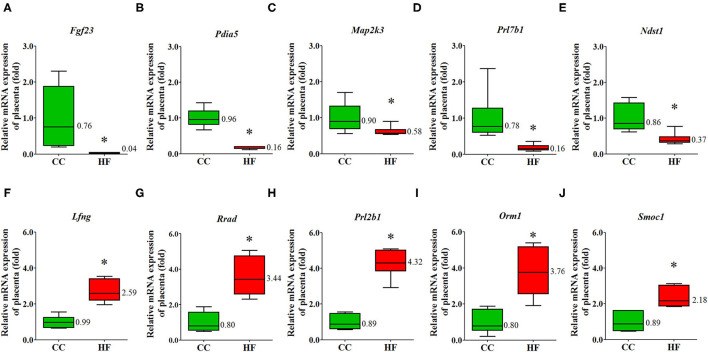
Figure 5.
Validation of dysregulated placental mRNA. The expression of dysregulated genes was compared between rats exposed to a high-fat diet or a control diet. Reverse transcription–quantitative polymerase chain reaction analysis was conducted to validate the mRNA profiles of five mRNAs determined using next-generation sequencing (NGS). (A) Fgf23, (B) Pdia5, (C) Map2k3, (D) Prl7b1 (E) Ndst1, (F) Lfng, (G) Rrad, (H) Prl2b1, (I) Orm1, (J) Smoc1. The results demonstrated that the expression patterns of these mRNAs are consistent with those determined by NGS. The housekeeping gene was 18S ribosomal RNA, and mRNA expression is presented in terms of relative fold. *P < 0.05 (n = 6 for each group). The median was shown. Fgf23, fibroblast growth factor 23; Pdia5, protein disulfide isomerase family A member 5; Map2k3, mitogen activated protein kinase 3; Prl7b1, prolactin-7B1; Ndst1, N-deacetylase and N-sulfotransferase 1; Lfng, LFNG O-fucosylpeptide 3-beta-N-acetylglucosaminyltransferase; Rrad, Ras-related glycolysis inhibitor and calcium channel regulator; Prl2b1, prolactin family 2, subfamily b, member 1; Orm1, orosomucoid 1; Smoc1, SPARC-related modular calcium binding 1.

