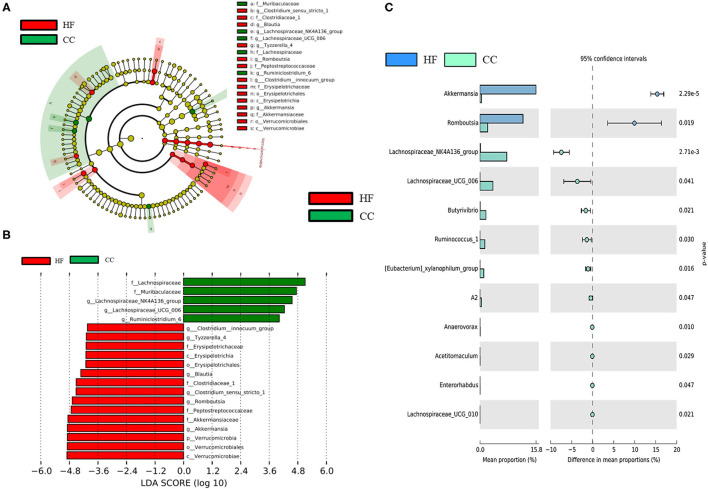
Figure 7.
LEfSe analysis identified crucial bacteria associated with exposure to a high-fat diet (HF) in rats. (A) Cladogram representing taxa at all phylogenetic levels indicated predominant bacteria associated with a control diet (CC) and HF diet. For the cladogram section, the circle from the inside to the outside indicates the classification stratum from the gate to the genus. Each small circle indicates a classification at that stratum, and the diameter of the circle represents its relative abundance. The colors indicate significant differences in the biomarkers and grouping between the two groups. (B) For the LDA distribution histogram, taxa that reached a linear discriminant analysis score (log10) of >2.0 were highlighted and labeled. (C) At the genus level, a significant difference was observed between the CC and HF groups. (n = 6 for each group).

