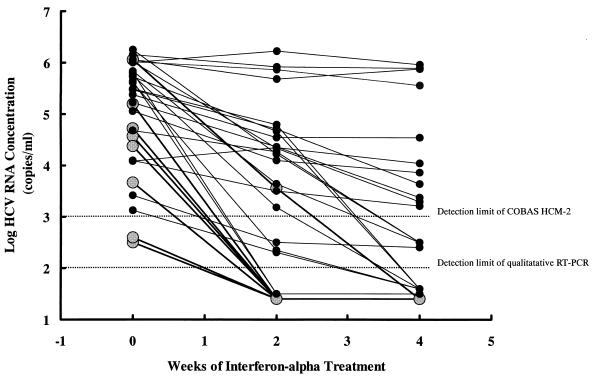
FIG. 3.
Dynamic change in serum HCV RNA levels determined by COBAS HCM-2 before and at 2 and 4 weeks after initiation of IFN-α treatment for 8 complete responders and 22 nonresponders. Black circles linked by bold lines represent complete responders. Solid dots linked by regular lines represent nonresponders.

