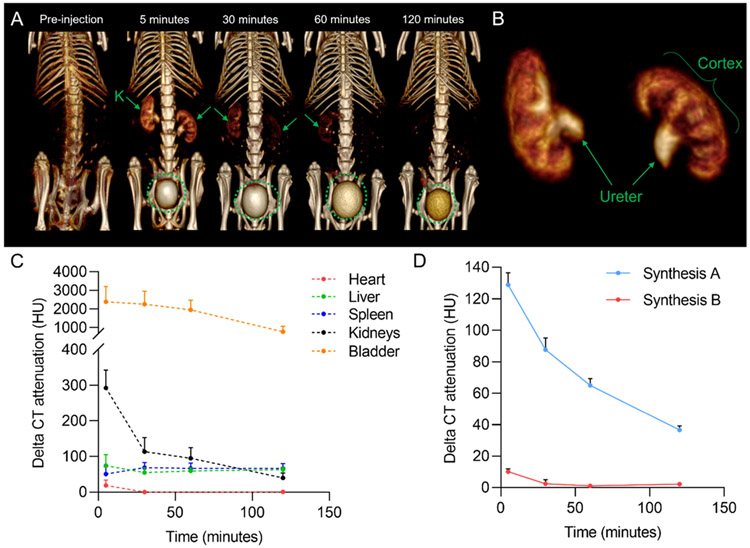
Figure 4.
In vivo CT imaging data for Ag2S-NPs synthesized using microfluidics. (A) Representative CT images of a mouse after injection using 3D volume rendering. The images are shown with a window level of 700 HU and a window width of 1000 HU. Kidneys are labeled K. Green circles indicate the bladder. (B) 3D region growing segmentation of mouse kidneys at 5 min post-injection to visualize glomerular filtration and collection of Ag2S-NPs into the bladder via the ureter. (C) Change in CT attenuation in various organs of mice compared to preinjection. (D) Change in CT attenuation in the blood of mice compared to preinjection. Error bars are SEM (n = 4).

