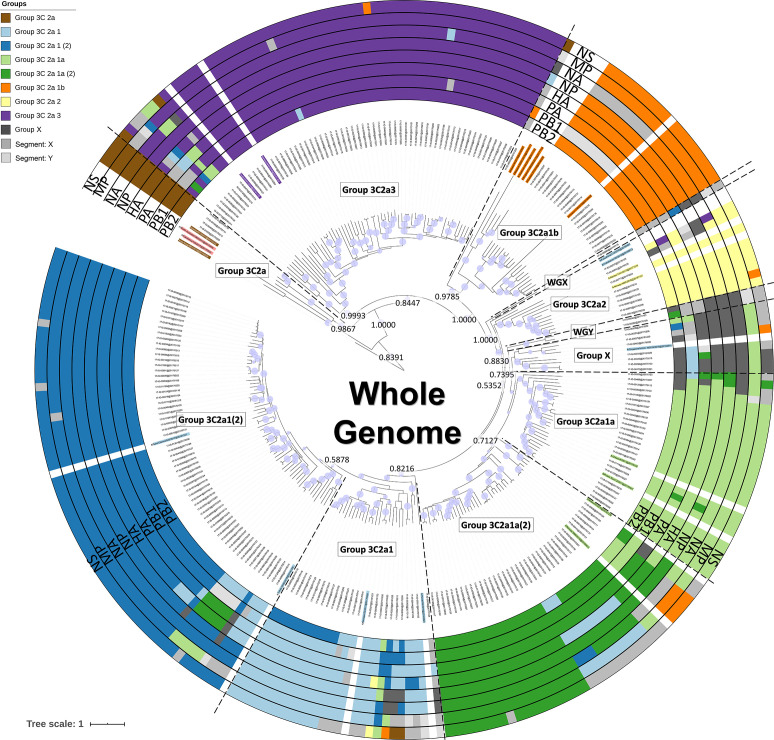
Fig. 2.
Phylogenetic tree based on the whole genome. Coloured names indicate additional references selected from ECDC reports and nextstrain.org. Coloured rings around the tree represent classification results for the eight segments separately (Fig. 2 for the HA gene, and Figs S2–S8 for the seven other genes). Group ‘X’ clustered together in a separate cluster from the other phylogenetic groups. Groups ‘WGX’ and ‘WGY’ contain samples that could not be classified. Groups labelled with the segment name and a single letter (e.g. PB1X) similarly represent any remaining samples that could not be confidently assigned into phylogenetic groups according to their segment trees (Figs S2–S8). Within the tree, the group labels represent the phylogenetic groups that were assigned to their respective samples according to their classification based on references (coloured names) and the support of nodes by posterior probability values. Posterior probability values are indicated on key nodes that separate phylogenetic groups. The size of the blue discs on nodes represents the posterior probability scaled between 0.5 and 1. The scale bar represents the mean number of substitutions per site.

