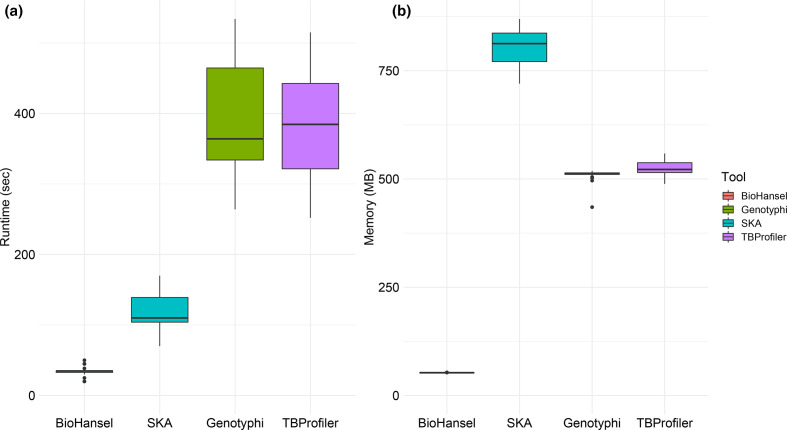
Fig. 4.
Boxplots of the runtime (a) and peak memory usage (b) comparison of four tools, BioHansel, Genotyphi, SKA and TBProfiler, on synthetic Illumina fastq data with a fixed coverage of 50×. BioHansel and SKA results are based on datasets representing both MTB and Typhi schemes (N=129) while genotyphi and TBProfiler results are only based on datasets representing either the Typhi (N=67) or the MTB (N=62) scheme, respectively.

