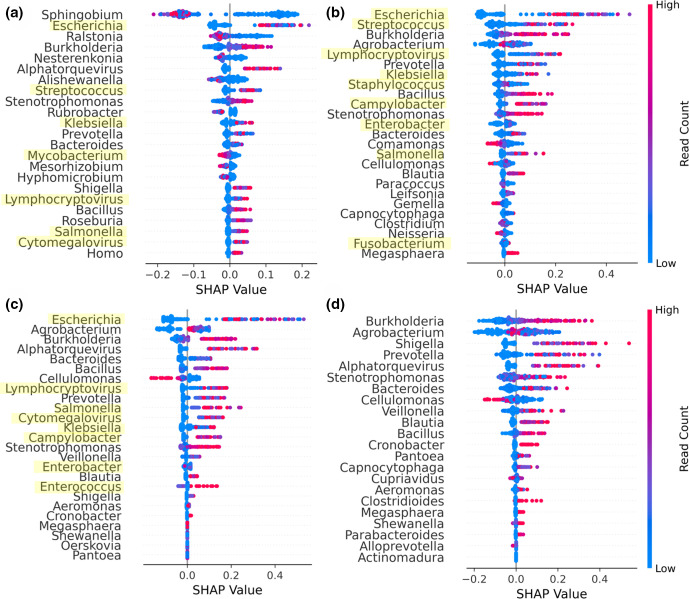
Fig. 1.
Model interpretation and performance. (a) Plot summarizing the SHAP values across all samples for the most important features ranked by the mean absolute SHAP value (highest at the top) for Karius-Neat, (b) Karius-SD, (c) Karius-CR and (d) Karius-Without models. Each point represents a single sample. Points with similar SHAP values were stacked vertically for visualization of point density and were coloured according to the magnitude of the feature values (i.e. read counts). Genera that contained ‘culture-confirmed’ pathogens are highlighted in yellow.

