Figure 2.
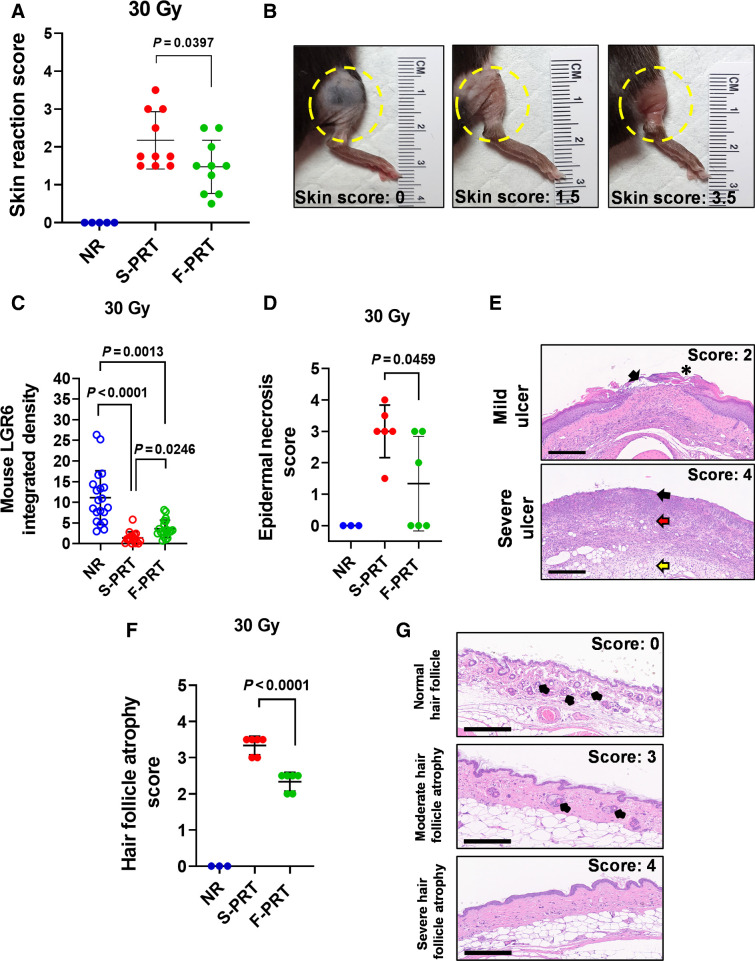
F-PRT alleviates skin damage compared with S-PRT. A, Skin reaction of the irradiated leg after exposure to 30 Gy of F-PRT or S-PRT. Maximum skin score for each mouse is presented over an observation period of 8 months. NR, n = 5; F-PRT and S-PRT, n = 10; statistical analysis by Welch t test. B, Pictures of irradiated skin damage scored as 1.5 or 3.5 compared with untreated skin (score 0); score of 1.5 indicates localized breakdown of the skin with a scaly/crusty appearance, whereas 3.5 corresponds to full-thickness skin barrier loss. C, Quantification of immunofluorescent detection of skin populations of Lgr6+ stem cells at 18 days following 30 Gy of F-PRT versus S-PRT. Lgr6+ cells were quantified on three to four skin sections per mouse (n = 5 mice, statistical analysis by Kruskal–Wallis test followed by Wilcoxon rank sum test.) D, Blinded evaluation of epidermal necrosis in skin hematoxylin and eosin–stained slides, at 27 days after 30 Gy of proton RT. NR, n = 3; F-PRT and S-PRT, n = 5; statistical analysis by Welch t test. E, Representative hematoxylin and eosin images of mild and severe ulceration. On the mild ulcer, black arrow points to ulcerated epidermis and an asterisk indicates a crust. On the severe ulcer, necrosis and inflammation are shown in the epidermis (black arrow), which extends through the dermis (red arrow) and subcutis (yellow arrow). Magnification, ×100. Scale bar, 300 μm. F, Blinded evaluation of hair follicle atrophy in skin hematoxylin and eosin–stained slides at 27 days after 30 Gy of PRT. NR, n = 3; S-PRT and F-PRT, n = 6. Statistical analysis by Welch t test. G, Representative images of hematoxylin and eosin–stained nonirradiated normal hair follicles and hair follicle atrophy of irradiated skin. Top, normal (nonirradiated) skin with normal hair follicle units (black arrows); middle, irradiated skin with hair follicle units (black arrows) that are reduced in number and size; bottom, hair follicles are completely absent. Hematoxylin and eosin, ×200 magnification. Scale bar, 200 μm. Values in A, C, D, and F represent mean ± SD.

