Figure 3.
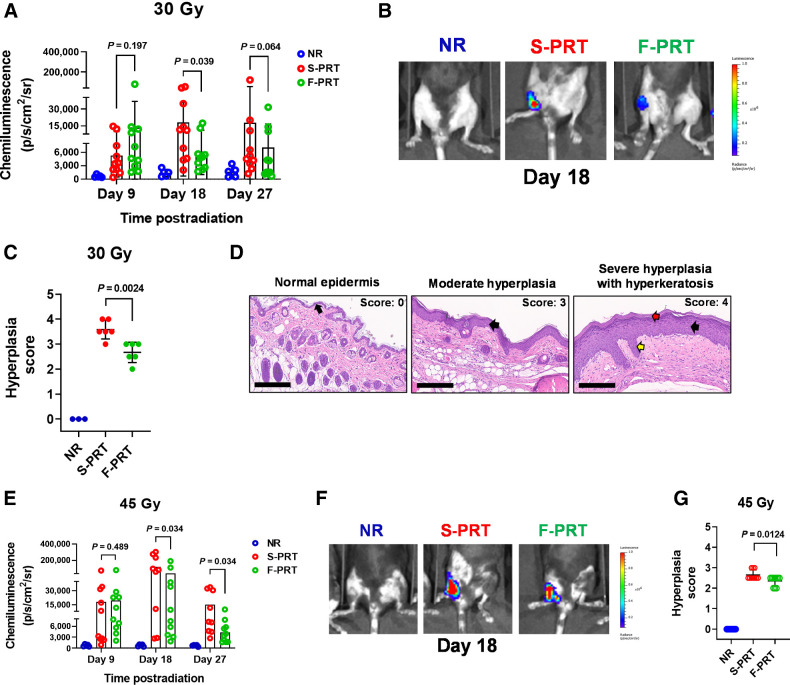
F-PRT reduces inflammation in the irradiated leg compared with S-PRT. A and B, For 30 Gy of proton irradiation, quantification of luminol chemiluminescence as a reporter of inflammation (A), accompanied by representative images of inflammatory signal at Day 18 (NR, n = 5; F-PRT and S-PRT, n = 10; statistical analysis by mixed-effects model; B). C, Blinded histopathologic evaluation of hyperplasia at 27 days post-PRT (NR, n = 3; F-PRT and S-PRT, n = 6; statistical analysis by Welch t test). D, Representative hematoxylin and eosin–stained images of skin hyperplasia. Left, normal epidermal layer (black arrow); middle, moderate chronic damage including a thickened hyperplastic epidermis (black arrow); right, severe chronic damage, including a severely thickened and hyperplastic epidermis (black arrow) with thick layers of orthokeratotic keratin (red arrow) and long rete pegs (yellow arrow). Hematoxylin and eosin, magnification, ×200. Scale bar, 200 μm. E and F, For 45 Gy of proton irradiation, quantification of luminol chemiluminescence (E), accompanied by representative images of inflammatory signal at Day 18 (NR, n = 5; F-PRT and S-PRT, n = 10; statistical analysis by mixed-effects model; F). G, Blinded histopathologic evaluation of hyperplasia at 27 days post-PRT. N = 10 per group with statistical analysis by Welch t test.

