. 2021 Jul 28;81(18):4808–4821. doi: 10.1158/0008-5472.CAN-21-1500

Figure 4.

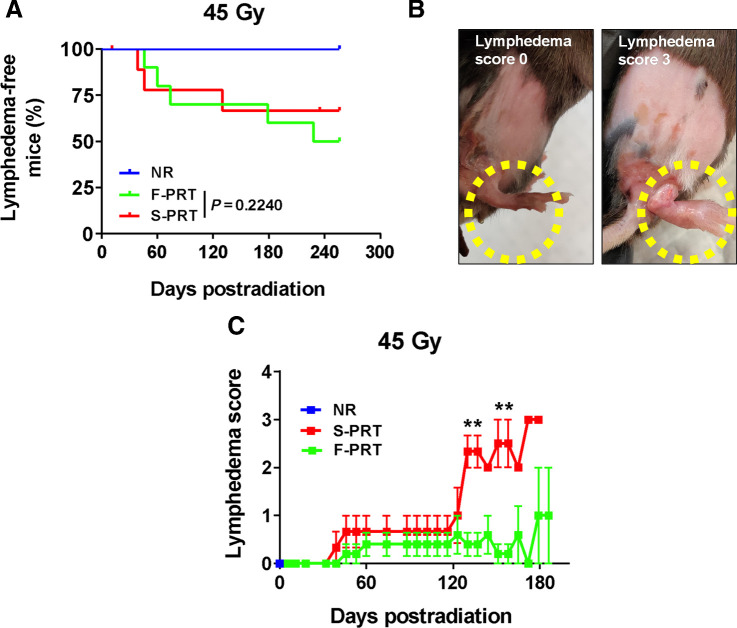
Figure 4. F-PRT reduces the severity of lymphedema. A, Kaplan–Meier curve of lymphedema incidence in mice that received PRT to the hind leg (45 Gy). NR, n = 5; F-PRT and S-PRT, n = 10; statistical analysis by log-rank test. B, Pictures of lymphedema representing scores of 0 (swelling < 1 mm) and 3 (swelling = 3 mm); swelling ≥3 mm mandates euthanasia of the mouse. C, Time course of severity among mice that developed lymphedema. F-PRT, n = 4; S-PRT, n = 3; statistical analysis by multiple cross-sectional t tests with FDR of 0.05; values represent mean ± SEM. **, P < 0.01.

F-PRT reduces the severity of lymphedema. A, Kaplan–Meier curve of lymphedema incidence in mice that received PRT to the hind leg (45 Gy). NR, n = 5; F-PRT and S-PRT, n = 10; statistical analysis by log-rank test. B, Pictures of lymphedema representing scores of 0 (swelling < 1 mm) and 3 (swelling = 3 mm); swelling ≥3 mm mandates euthanasia of the mouse. C, Time course of severity among mice that developed lymphedema. F-PRT, n = 4; S-PRT, n = 3; statistical analysis by multiple cross-sectional t tests with FDR of 0.05; values represent mean ± SEM. **, P < 0.01.