. 2021 Jul 28;81(18):4808–4821. doi: 10.1158/0008-5472.CAN-21-1500

Figure 5.

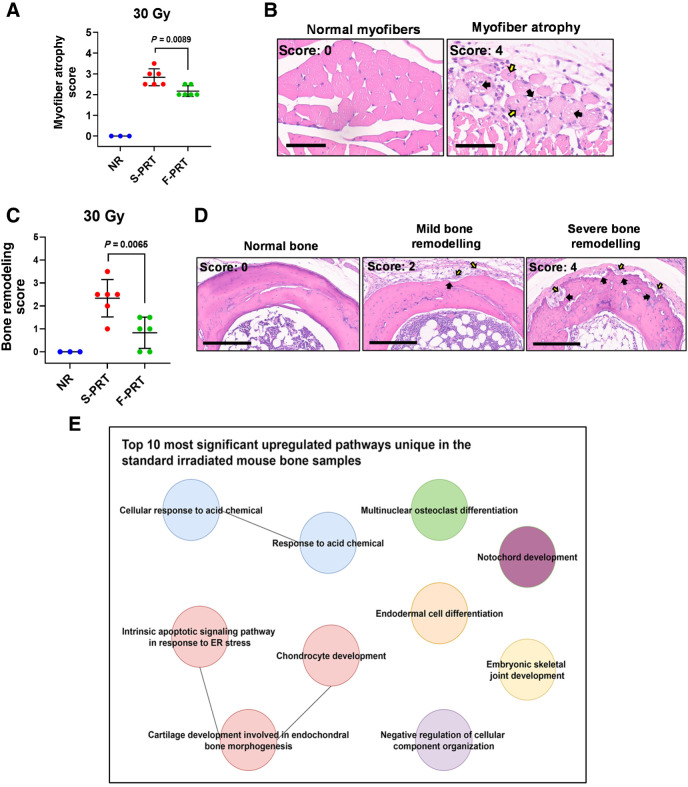
Figure 5. Damage to the muscle and bone by proton RT is ameliorated by F-PRT as compared with S-PRT. A, Blinded evaluation of myofiber atrophy of the gastrocnemius muscle of mice treated by 30 Gy of F-PRT versus S-PRT, at 27 days after RT. Statistical analysis by Welch t test. B, Representative images of hematoxylin and eosin–stained nonirradiated normal myofibers and myofiber atrophy of irradiated tissue. Myofibers of the irradiated tissue show degenerative changes including decreased cross-sectional diameter (i.e., atrophy), vacuolation of the cytoplasm (black arrows), and internalization of nuclei (yellow arrows). Hematoxylin and eosin, magnification, ×400. Scale bar, 60 μm. C, Blinded evaluation of bone remodeling in mice treated by 30 Gy of F-PRT versus S-PRT, at 27 days after PRT. Statistical analysis by Welch t test. D, Representative images of hematioxylin and eosin–stained bone sections. Left, normal (nonirradiated) bone with normal bone marrow; middle, irradiated bone with resorption (black arrows) lined by activated osteoclasts and osteoblasts (yellow arrows); right, multiple large regions of bone resorption (black arrows) with numerous activated osteoclasts and osteoblasts (yellow arrows). Hematoxylin and eosin, magnification, ×200. Scale bar, 200 μm. For A and C, NR, n = 3; F-PRT and S-PRT, n = 6; statistical analysis by Welch t test. Values in A and C represent mean ± SD. E, Gene ontology enrichment analysis of the differentially expressed (upregulated) genes in the S-PRT-treated mouse leg bone; n = 4 per group.

Damage to the muscle and bone by proton RT is ameliorated by F-PRT as compared with S-PRT. A, Blinded evaluation of myofiber atrophy of the gastrocnemius muscle of mice treated by 30 Gy of F-PRT versus S-PRT, at 27 days after RT. Statistical analysis by Welch t test. B, Representative images of hematoxylin and eosin–stained nonirradiated normal myofibers and myofiber atrophy of irradiated tissue. Myofibers of the irradiated tissue show degenerative changes including decreased cross-sectional diameter (i.e., atrophy), vacuolation of the cytoplasm (black arrows), and internalization of nuclei (yellow arrows). Hematoxylin and eosin, magnification, ×400. Scale bar, 60 μm. C, Blinded evaluation of bone remodeling in mice treated by 30 Gy of F-PRT versus S-PRT, at 27 days after PRT. Statistical analysis by Welch t test. D, Representative images of hematioxylin and eosin–stained bone sections. Left, normal (nonirradiated) bone with normal bone marrow; middle, irradiated bone with resorption (black arrows) lined by activated osteoclasts and osteoblasts (yellow arrows); right, multiple large regions of bone resorption (black arrows) with numerous activated osteoclasts and osteoblasts (yellow arrows). Hematoxylin and eosin, magnification, ×200. Scale bar, 200 μm. For A and C, NR, n = 3; F-PRT and S-PRT, n = 6; statistical analysis by Welch t test. Values in A and C represent mean ± SD. E, Gene ontology enrichment analysis of the differentially expressed (upregulated) genes in the S-PRT-treated mouse leg bone; n = 4 per group.