. 2021 Jul 28;81(18):4808–4821. doi: 10.1158/0008-5472.CAN-21-1500

Figure 6.

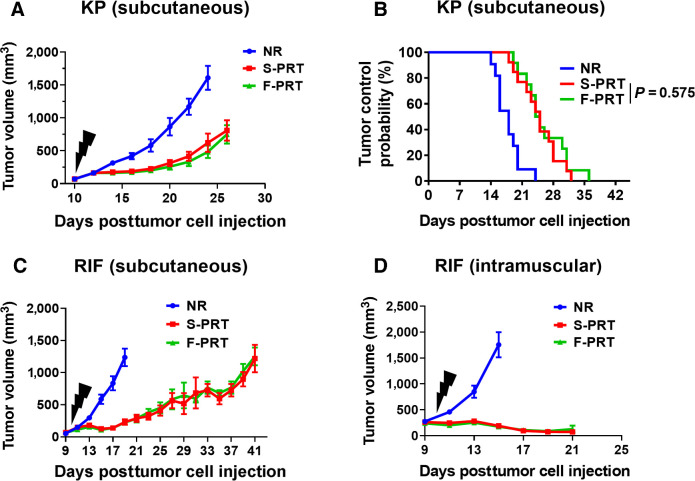
Figure 6. F-PRT and S-PRT are equipotent in treatment of two models of murine sarcoma. A, Growth curve of murine sarcoma established from sarcoma cells isolated from GEMM model LSL-KrasG12D/wt;p53FL/FL and subcutaneously propagated in C67BL/6 mice, followed by irradiation with 12 Gy of F-PRT or S-PRT. N = 9, statistical analysis by log-rank test. B, Tumor control probability following F-PRT vs. S-PRT of the sarcoma-bearing mice with tumors reaching a volume of <500 mm3. N = 13, statistical analysis by log-rank test. C, Growth curve of RIF murine fibrosarcomas subcutaneously propagated in C3H/HeJ mice irradiated with 30 Gy of F-PRT or S-PRT. N = 8 mice per group; statistical analysis by log-rank test. D, Growth curve of RIF tumor propagated orthotopically in the leg muscle (intramuscular) and irradiated with 30 Gy of F-PRT or S-PRT. N = 5 mice per group; statistical analysis by log-rank test. All tumors were irradiated on Day 10 after tumor cell inoculation (black lightning symbol). Data of A, C, and D plot mean ± SD.

F-PRT and S-PRT are equipotent in treatment of two models of murine sarcoma. A, Growth curve of murine sarcoma established from sarcoma cells isolated from GEMM model LSL-KrasG12D/wt;p53FL/FL and subcutaneously propagated in C67BL/6 mice, followed by irradiation with 12 Gy of F-PRT or S-PRT. N = 9, statistical analysis by log-rank test. B, Tumor control probability following F-PRT vs. S-PRT of the sarcoma-bearing mice with tumors reaching a volume of <500 mm3. N = 13, statistical analysis by log-rank test. C, Growth curve of RIF murine fibrosarcomas subcutaneously propagated in C3H/HeJ mice irradiated with 30 Gy of F-PRT or S-PRT. N = 8 mice per group; statistical analysis by log-rank test. D, Growth curve of RIF tumor propagated orthotopically in the leg muscle (intramuscular) and irradiated with 30 Gy of F-PRT or S-PRT. N = 5 mice per group; statistical analysis by log-rank test. All tumors were irradiated on Day 10 after tumor cell inoculation (black lightning symbol). Data of A, C, and D plot mean ± SD.