
Figure 5.
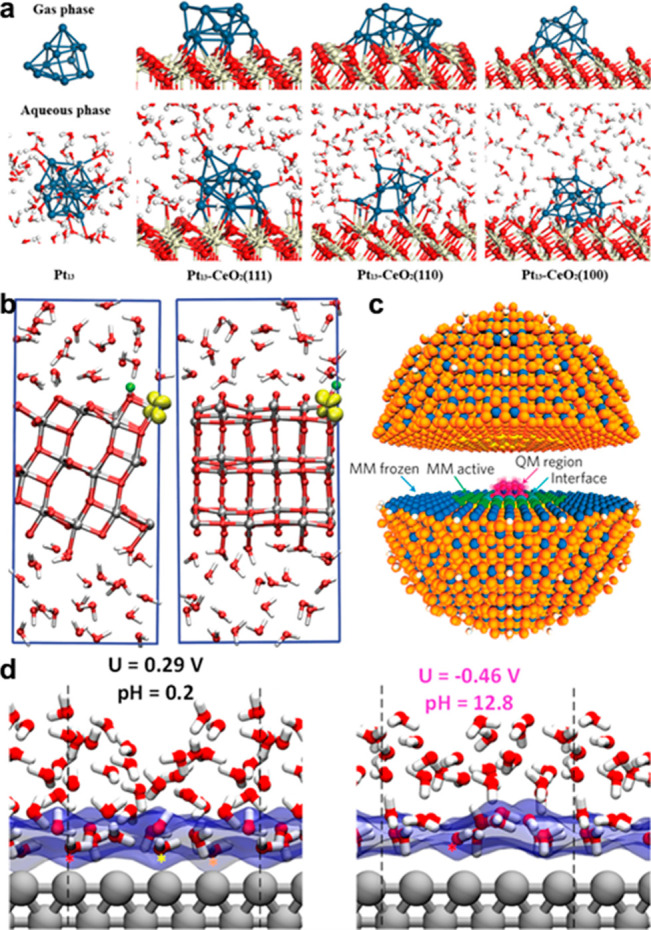
(a) Electron density difference plots for the optimized CeO2-supported Pt13 cluster in the gas and aqueous phases. Reprinted with permission from ref (49). Copyright 2018 American Chemical Society. (b) Hydroxylated anatase (101) slab immersed in water; the eex– is shown as a yellow iso-surface plot. Reprinted from ref (103). Copyright 2018 Nature Portfolio. (c) Graphic of the QM/MM cluster used for rutile in the positive charge state. The cluster is divided into hemispheres to highlight the different regions in the model. Hole density iso-surfaces are shown in the QM region. Reprinted from ref (105). Copyright 2018 Nature Portfolio. (d) The snapshots with atomic details of the interfaces are shown at U = +0.29 V and at U = −0.46 V. The first layer of water is highlighted by a plot of the van der Waals surface of oxygen as transparent blue. Reprinted with permission from ref (106). Copyright 2018 American Chemical Society.