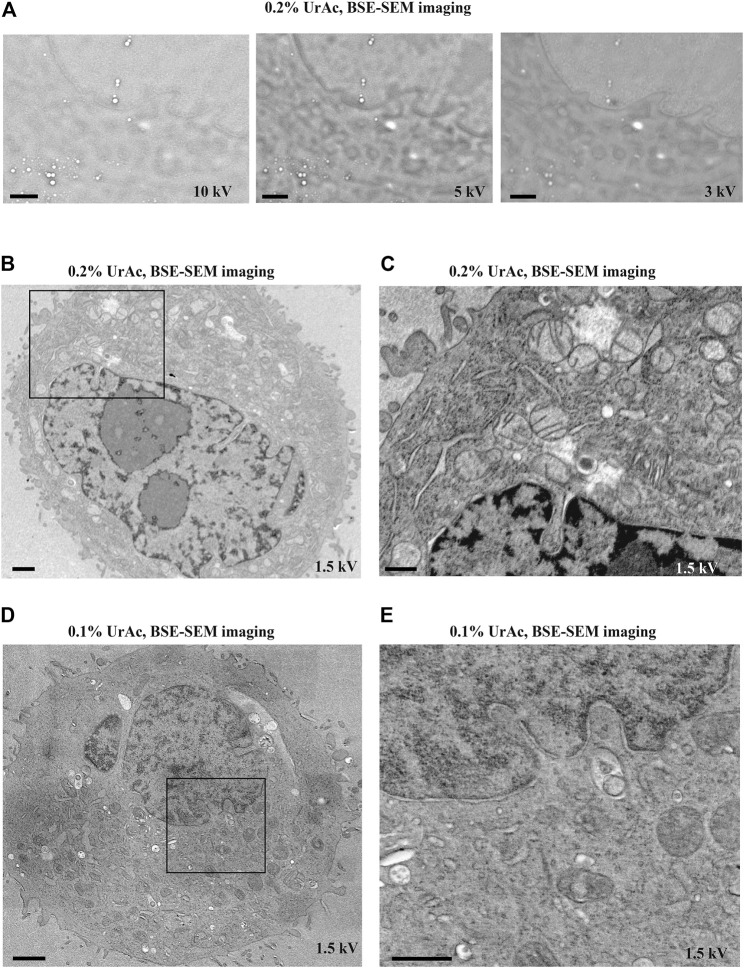
FIGURE 3.
The effect of accelerating voltage and different concentrations of uranyl acetate on image quality (inverse contrast). All images are acquired by SEM and BSE-detector. (A) By lowering the accelerating voltage from 10 kV (A, left) to 5 kV (A, middle) to 3 kV (A, right) imaging of ultrastructural features of trypsinized cells freeze-substituted with 0.2% UrAc gradually improves. (B, C) However, the same cells imaged by SEM at 1.5 kV have superior quality, as judged by nuclear details (B) and cristae of the mitochondria in an enlarged view of the area (C) from the black box in (B). (D) Images of representative trypsinized cells freeze-substituted and processed with 0.1% UrAc and imaged with 1.5 kV display a drop in the image quality compared to cells processed with 0.2% UrAc and imaged with same accelerating voltage (B, C). WD A left = 6.6 mm, middle = 6.9 mm, right = 7.6 mm; (B, C) = 9.7 mm; (D) = 9.9 mm. Section thickness = 200 nm. Abbreviations: BSE, backscattered electrons (Gatan OnPoint detector); SEM, scanning electron microscope; UrAc, uranyl acetate; WD, working distance. Scale bars: (A, B, D) = 1 μm; (C, E) = 0.5 µm.

