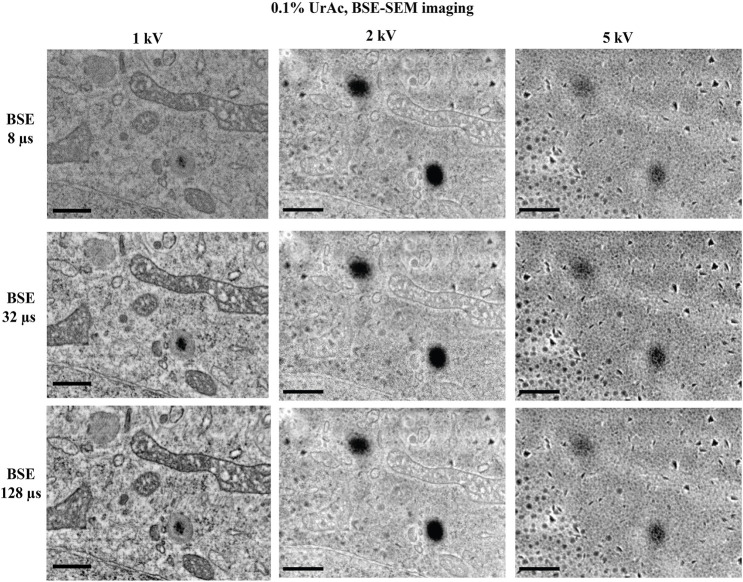
FIGURE 4.
The effect of varying dwell time on image quality. All images are taken from trypsinized cells freeze-substituted and processed with 0.1% uranyl acetate, and imaged by SEM and BSE-detector at an accelerating voltage of 1, 2 and 5 kV. Clearly the image quality was optimal at 1 kV with well resolved mitochondrial details and nuclear envelope. However, at 2 kV the image started to display blob-like structures and at 5 kV no cellular ultrastructure could be discerned; only the blobs were very clear. Reducing the dwell time from 128 µs (third row) per pixel to a mere 8 µs (top row) per pixel has no major effect on the image quality, at none of the tested accelerating voltages. WD 1 kV = 6.1 mm; 2 kV = 4.7 mm; 5 kV = 4.1 mm. Section thickness = 150 nm. Abbreviations: BSE, backscattered electrons (Gatan OnPoint detector); WD, working distance; UrAc, uranyl acetate. Scale bars: 0.5 µm.

