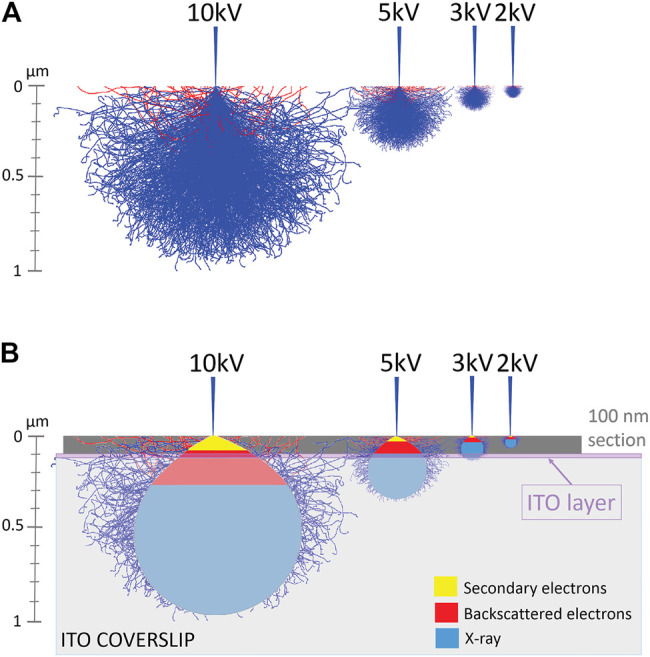
FIGURE 5.

Monte Carlo simulations of the interaction volume of electrons and carbon, demonstrating the relationship between penetration of electrons in a sample and accelerating voltage of the SEM. (A) Simulated interaction volumes in carbon sample in function of accelerating voltage of the SEM. (B) A schematic indication of the regions of interaction volume that produce secondary electrons (yellow region) and backscattered electrons (red region) is added. Abbreviations: ITO, indium-tin-oxide; SEM scanning electron microscope.
