FIGURE 8.
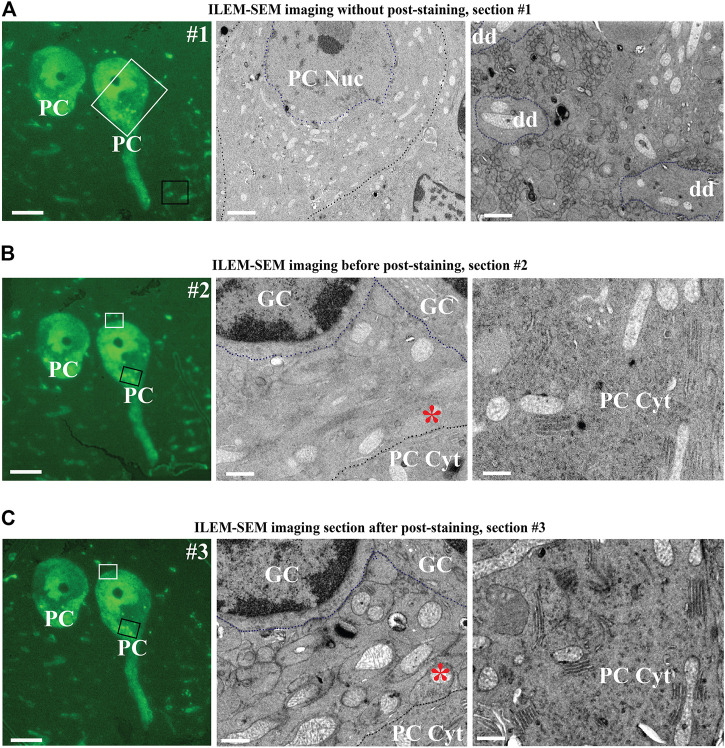
Three consecutive sections of mouse cerebellum immunolabeled for calbindin D28 K and imaged with ILEM-SEM system (JEOL BSE detector). (A–B, left) Same two large fluorescent Purkinje cells as in the center of Figure 7C, in two immediately adjacent consecutive 150 nm sections without any additional post-staining, imaged at higher magnifications with ILEM-SEM in FM mode with Plan Apo VC 100x lens. (A–B, middle and right) ILEM EM mode images indicated by white and black boxes in A–B, left. Purkinje cell boundaries (A–B, middle), granular cells (B, middle) and three cross-sectioned dendrites (A, right) are demarcated by a dotted line for ease of recognition. (C, middle and right) Higher magnifications ILEM-SEM images from the regions indicated by white and black boxes in (C, left). The images in C (middle and right) represent next consecutive section at the same place as in 8 B (middle and right), but after post-staining with uranyl acetate and lead citrate. Post-staining enhanced contrast, so that the mitochondria, membranes, the secretory pathway organelles in PC cytoplasm, and climbing fiber synapse (asterisk in B middle as compared C middle) are now well distinguished. Abbreviations: Cyt, cytoplasm; dd, dendrite; ILEM-SEM, integrated light and electron microscope; IRF, in-resin fluorescence; GC, granular cell; Nuc, nucleus; PC, Purkinje cell. Scale bars: (A–C), left = 10 μm; (A–C), middle = 0.6 µm; (A–C), right = 0.8 µm.

