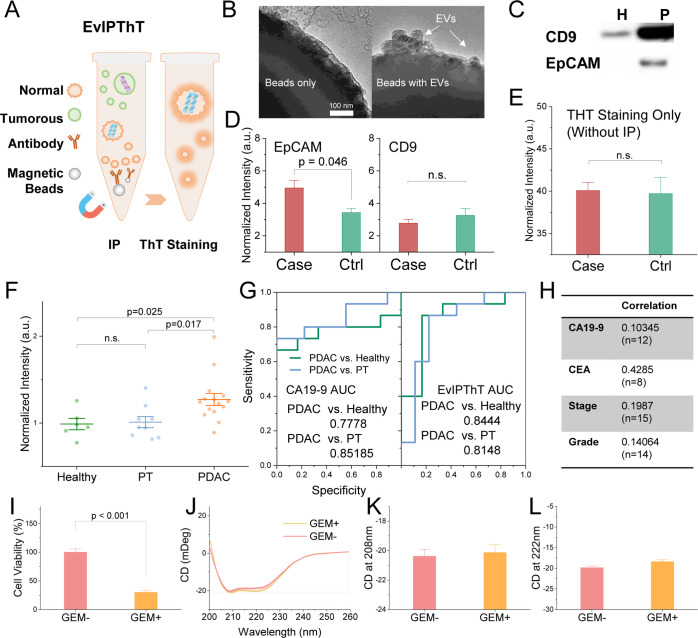
Figure 3.
EvIPThT, a noninvasive screening option targeting tumorous EV BR. (A) Diagram of EvIPThT combining IP and ThT staining. (B) TEM images showing IP enrichment of EpCAM + EVs. (C) Western blotting analysis of EpCAM and CD9 in H and P cells. (D) Assay validation with anti-EpCAM and CD9 for IP. The case sample was constructed by spiking 5% EVs from PANC-1 cells into serum from a healthy donor. Control (ctrl): serum from the healthy donor (n = 4). (E) ThT staining only without IP for the case and ctrl sample (n = 4). (F) EvIPThT readout in healthy donors, PDAC, and pancreatitis (PT) patients (n = 6, 15, and 9, respectively). (G) ROC curve for EvIPThT from the pilot cohort. (H) Kendall correlation coefficients of EvIPThT to circulating CA19-9 and CEA, tumor stage and grade. (I) Viability of MIA PaCa-2 cells with and without gemcitabine (GEM) treatment (50 μM). (J–L) CD spectra, peak value at 222 and 208 nm (due to π → π* and n → π* transition, respectively), of the MIA PaCa-2 cellular proteins’ CD spectra at a protein concentration of 0.5 mg/mL. H: HPNE; M: MIA PaCa-2; and P: PANC-1. Error bars, mean ± s.e.m; n = 3; n.s., not significant; and p values were determined by unpaired two-tailed t-tests.

