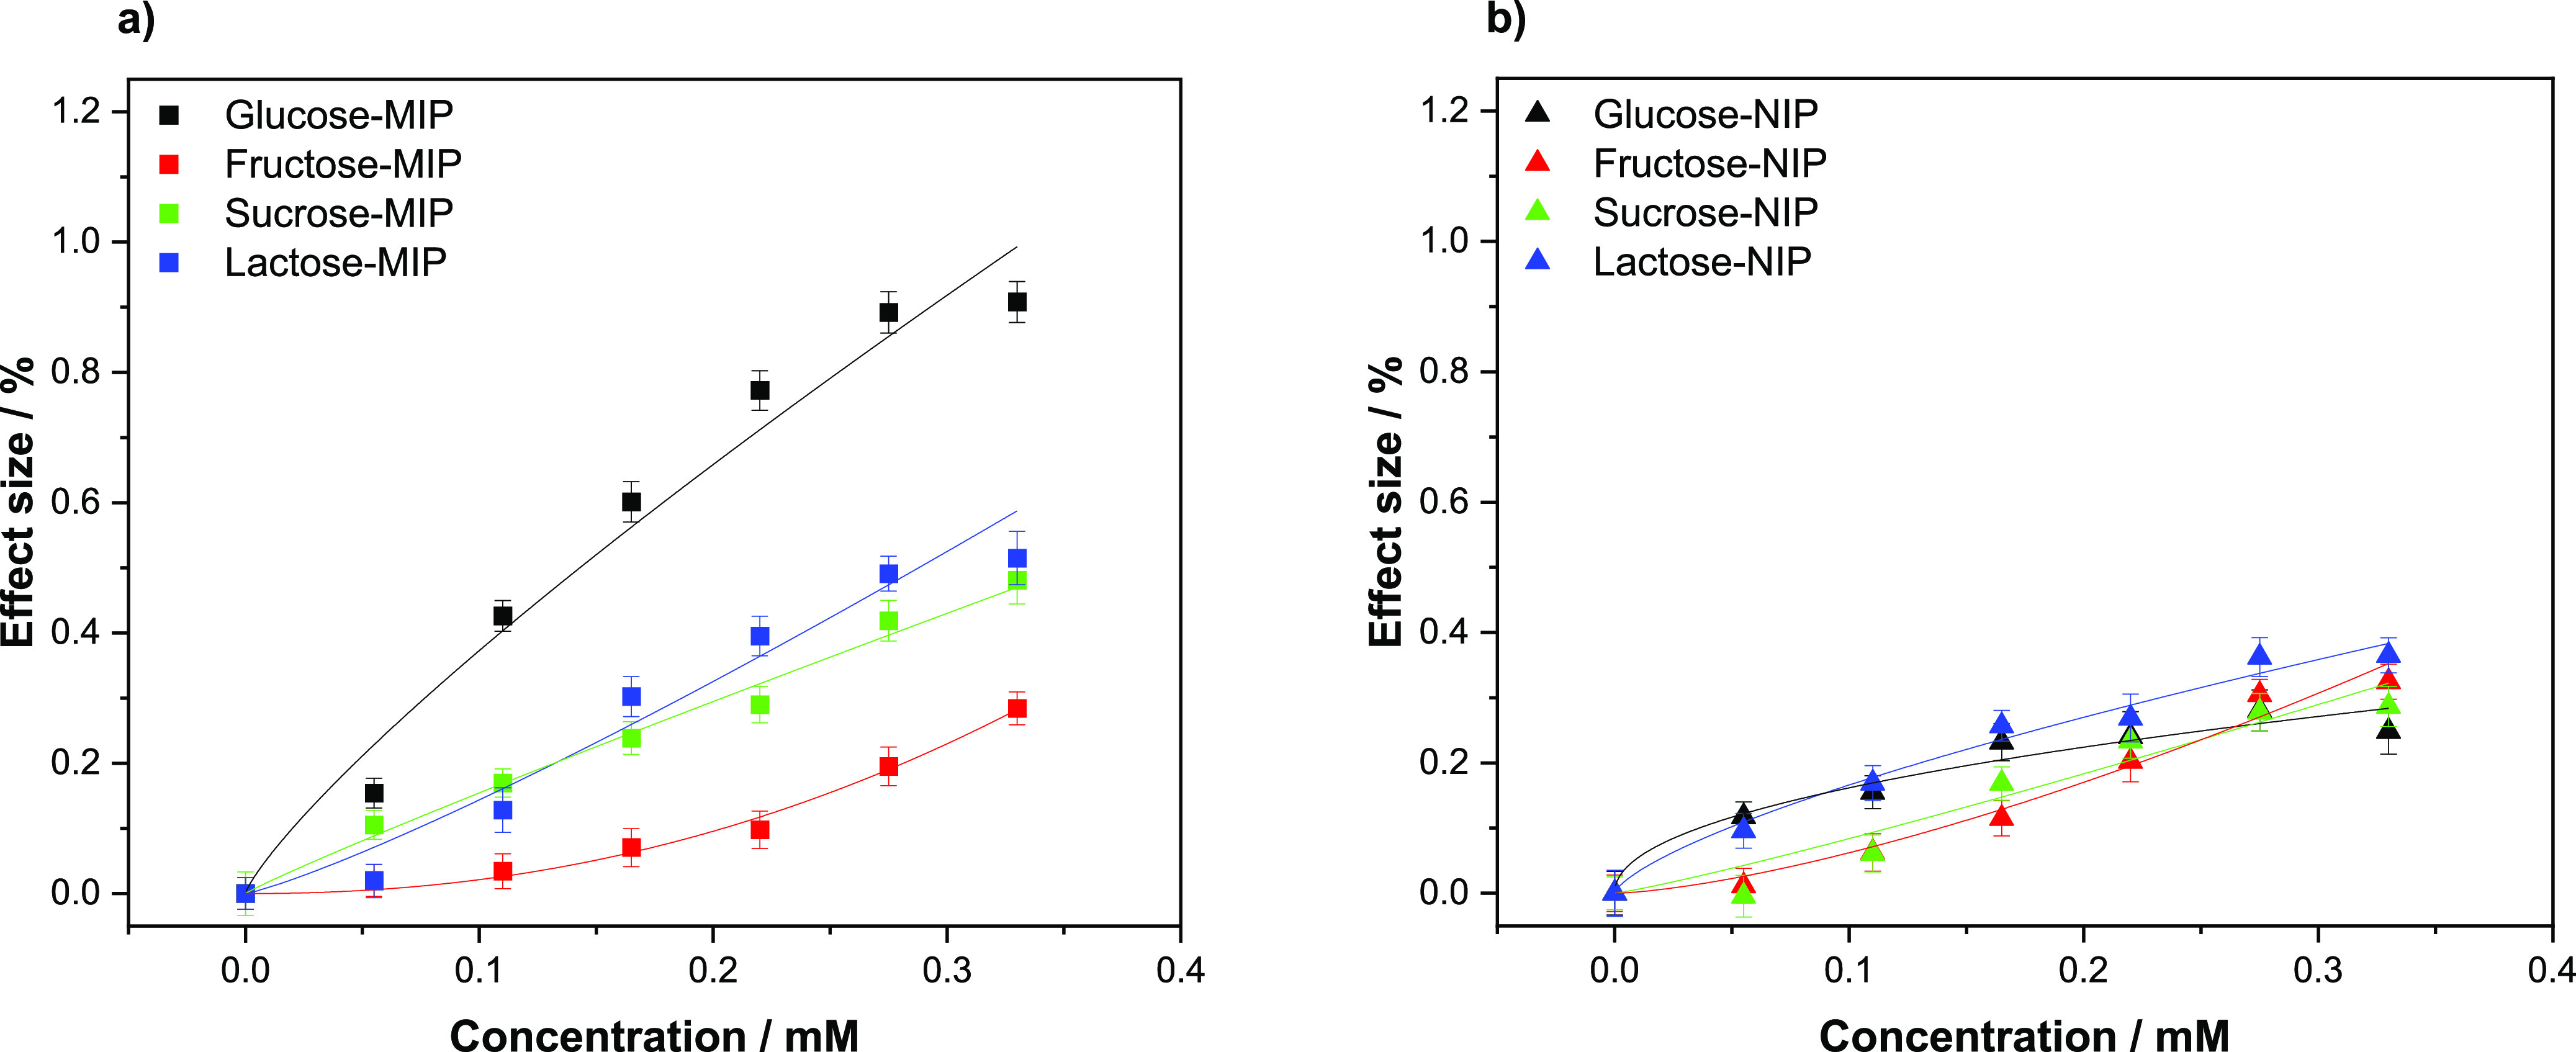
Figure 10.

(a) HTM analysis of compounds (glucose, fructose, sucrose, and lactose) introduced inside the flow cell and infused at increasing concentrations in PBS (0.00–0.33 mM) and their corresponding dose–response curves for (a) MIPs and (b) NIPs. Error bars and mean values are calculated using the noise of the signal and are the average of multiple measurements.
