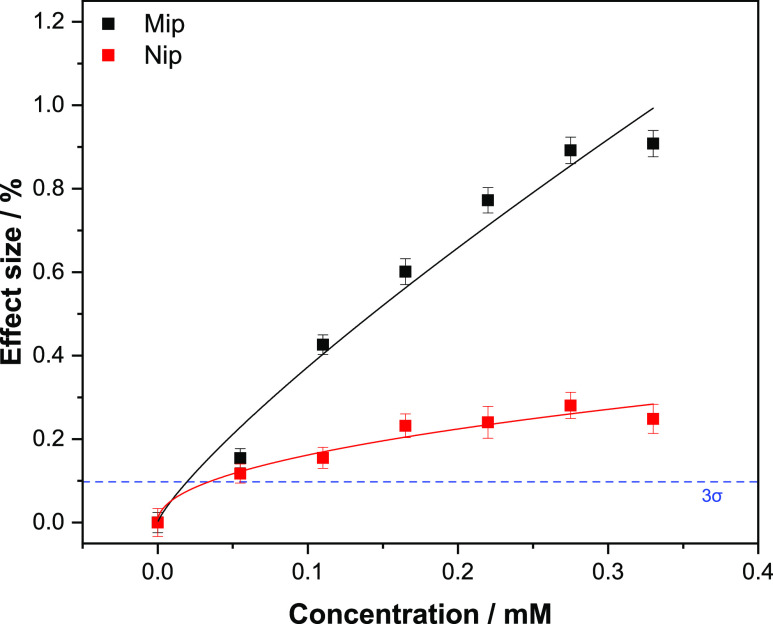
Figure 9.
Dose–response curve obtained by HTM analysis of the MIP/NIP after infusions of different concentrations of glucose, the blue dashed line reveals the LoD (3σ method) at ± 19.4 μM. Error bars and mean values are calculated using the noise of the signal and are the average of multiple measurements.

