Figure 4.
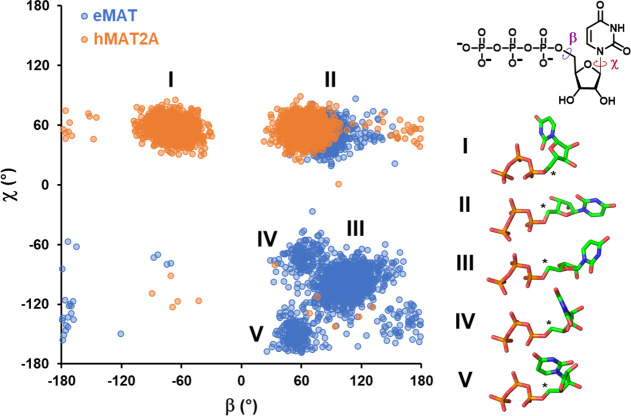
Conformational states populated by the UTP substrate bound to eMAT or hMAT2A. A plot of the UTP β vs χ dihedral angles (shown on the inset 2D representation of UTP) highlights the differences in conformational diversity exhibited by UTP in complex with eMAT or hMAT2A. Each data point represents a dihedral angle pair from one UTP molecule in one simulation frame, sampled every nanosecond over triplicate 500 ns trajectories. Dihedral angle measurements from different enzyme subunits were treated as independent data points. Major conformational clusters in the resulting landscape are shown as a stick representation with the electrophilic C5′ identified with an asterisk. The different conformational states adopted by UTP in eMAT and hMAT2A are indicative of differing enzyme–substrate interactions that constrain the UTP conformation and may contribute to enzyme specificity.

