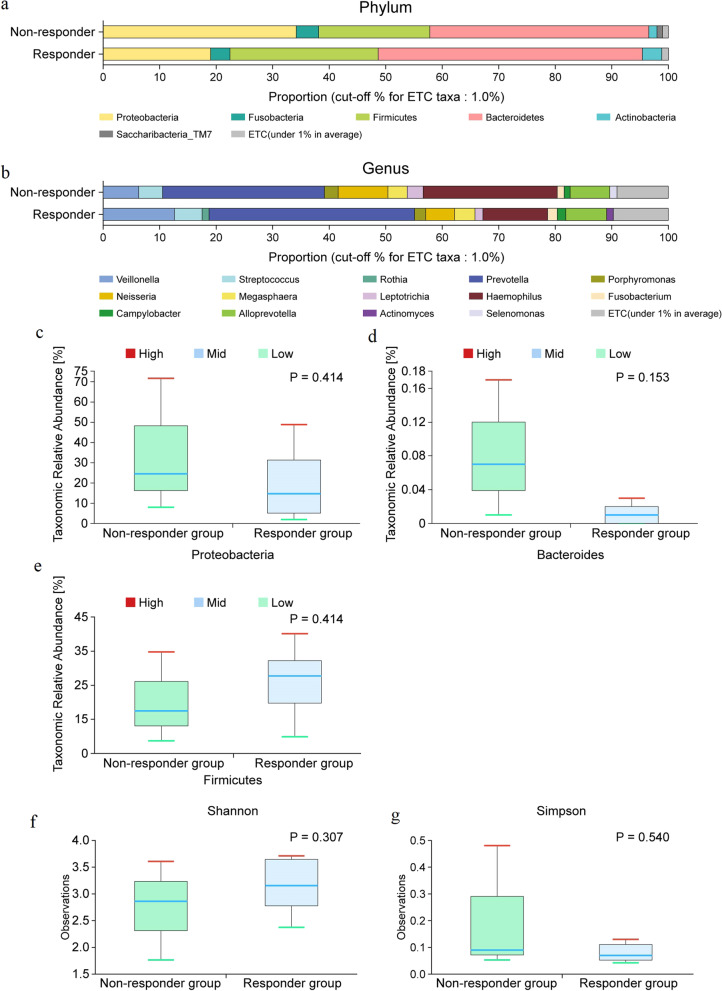
Fig. 3.
Taxonomic composition of the microbiome community between subgroups. a Dominant phyla based on response to immunotherapy (N = 11); Non-responder (N = 3), Responder (N = 8), b Dominant genera based on response to immunotherapy (N = 11); Non-responder (N = 3), Responder (N = 8). Differential abundances of phyla c Proteobacteria, d Bacteroides, and e Firmicutes between the immunotherapy responder and non-responder groups. Comparison of the α diversity in bronchoalveolar lavage fluid microbiomes between the responder and non-responder groups. f Shannon index, g Simpson index; upper box = 2nd quartile; mid line = median; lower box = 3rd quartile; whiskers = highest and lowest quartile

