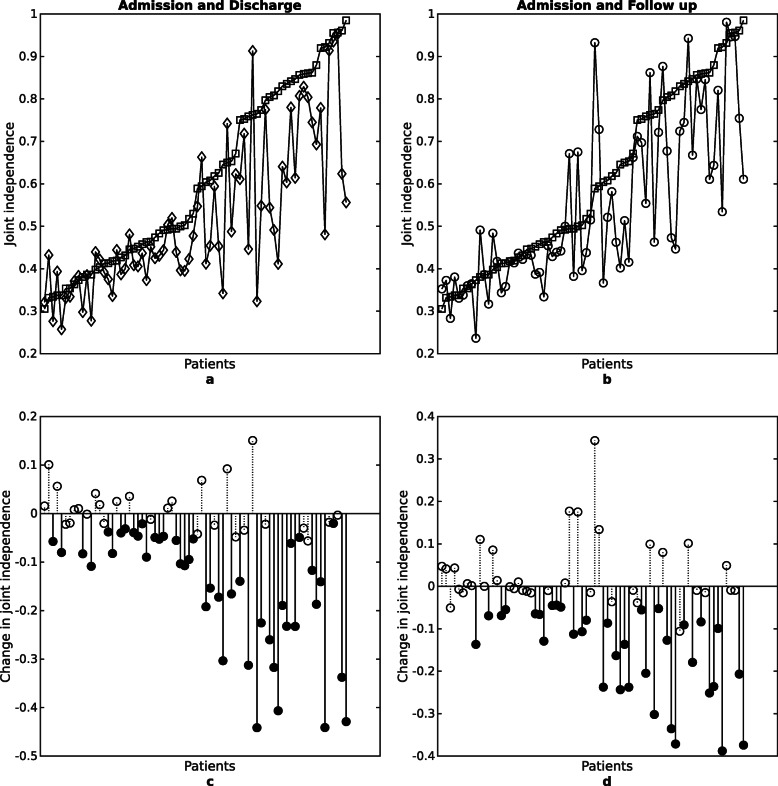
Fig. 4.
Improvements in joint independence over time. To afford direct comparison with Figs. 4 and 5 of (Dipietro et al., 2007), here we employed the same non-corrected significance at P < .05 level. Individual values of joint independence metric (a and b for all patients), sorted by their performance at admission (squares) in comparison to discharge (diamonds), and follow-up (circles). A lower number indicates greater/improving joint independence. Figures c and d represent changes in the joint independence metric, where filled circles indicate significance at discharge (c) and follow-up (d)

