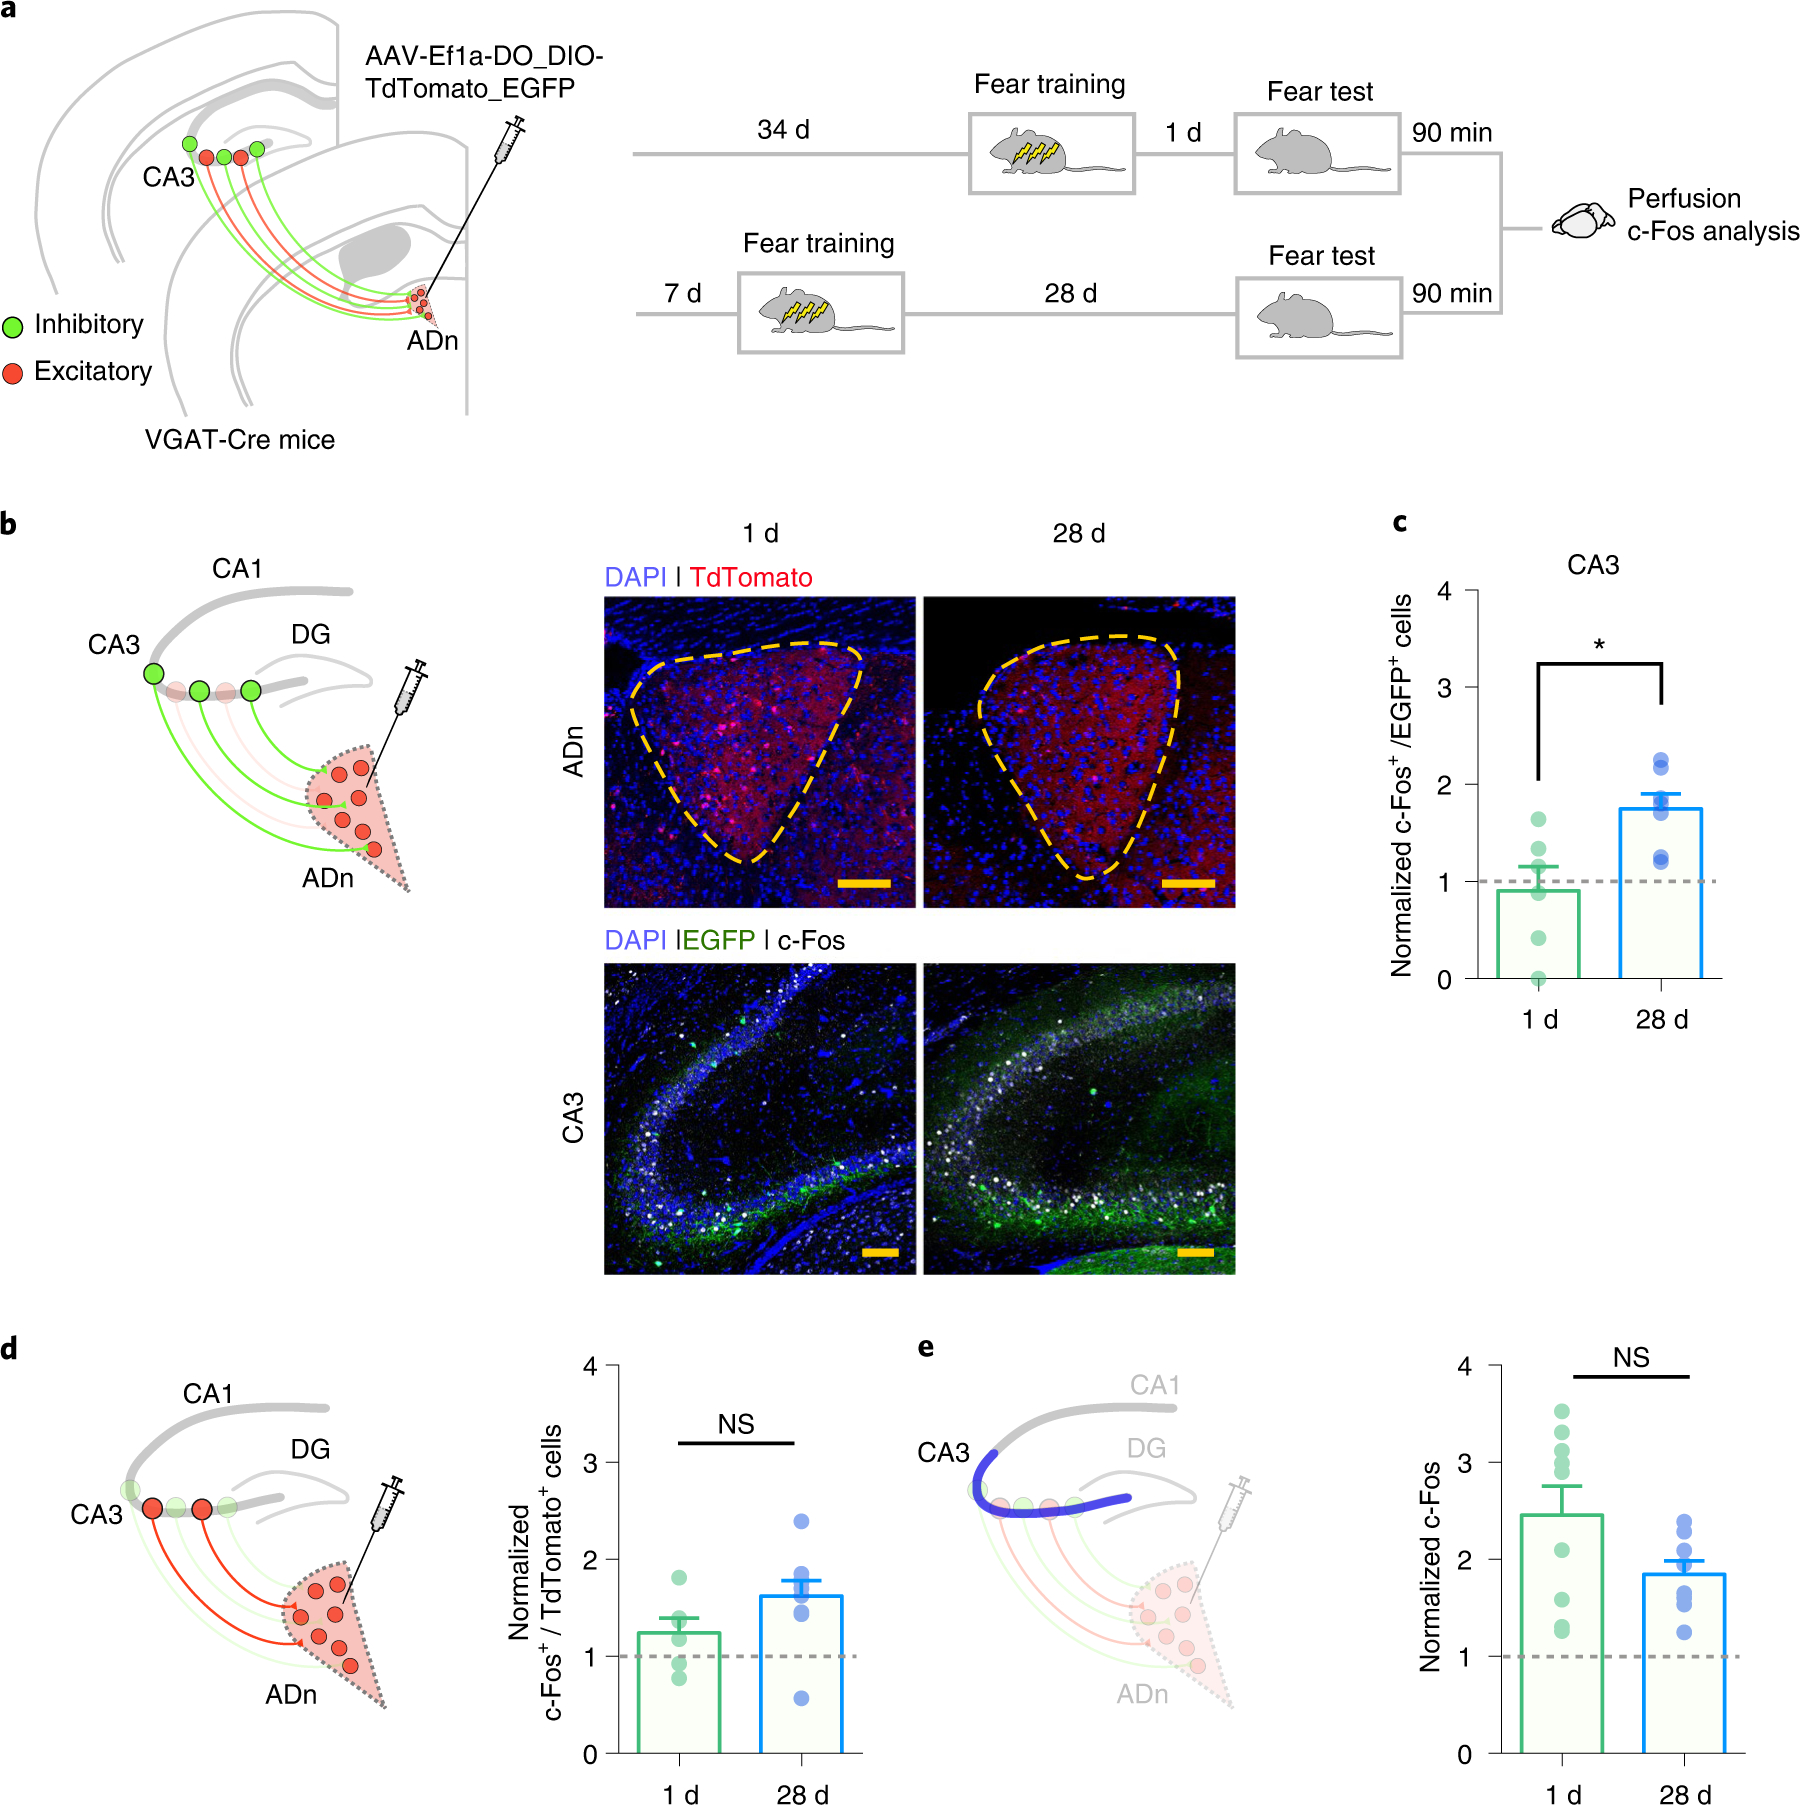
Fig. 4 |. CA3 inhibitory cells projecting to the ADn become more active at the remote time-point post-training.

a, VGAT-Cre mice were micro-infused with AAV-Ef1a-DO_DIO-TdTomato_EGFP in ADn to retrogradely label inhibitory (EGFP+) and excitatory (TdTomato+) cells that project to the ADn. After viral infusion, mice were then trained in contextual fear conditioning and tested 1 or 28 d post-training. At 90 min after the test, mice were killed and their brains processed to analyze c-Fos expression in CA3. b, Representative images showing viral infusion site in the ADn, retrogradely labeled inhibitory cells in CA3 and expression of c-Fos in both regions, at 1 and 28-d time-points (repeated in n = 6 (1 d); n = 7 (28 d); scale bar, 100 μm). c, Mice tested at 28 d post-training showed higher colocalization of EYFP+ and c-Fos+ cells in CA3, in comparison with mice tested at 1 d post-training (colocalization of EYFP+ and c-Fos+ cells, normalized to mean colocalization level in home-cage control mice (n = 4), adjusted for multiple-comparisons with Bonferroni–Dunn method; 1 d n = 6; 28 d n = 7; two-sided t-tests t11 = 2.98, P = 0.038). d, Mice tested at 1 or 28 d post-training showed similar levels of colocalization of TdTomato+ and c-Fos+ cells in CA3 (colocalization of EYFP+ and c-Fos+ cells, normalized to mean colocalization level in home-cage control mice (n = 3), adjusted for multiple-comparisons with Bonferroni–Dunn method; 1 d n = 6; 28 d n = 9; two-sided t-tests t13 = 1.62, P = 0.39). e, Mice tested at 1 or 28 d post-training showed similar levels of total c-Fos+ cells in CA3 (total c-Fos+ cells normalized to mean c-Fos levels in home-cage control mice (n = 7), adjusted for multiple-comparisons with Bonferroni–Dunn method; 1 d n = 9; 28 d n = 8; two-sided t-tests t15 = 1.77, P = 0.29). Data are mean ± s.e.m. (NS, not significant; *P < 0.05).
