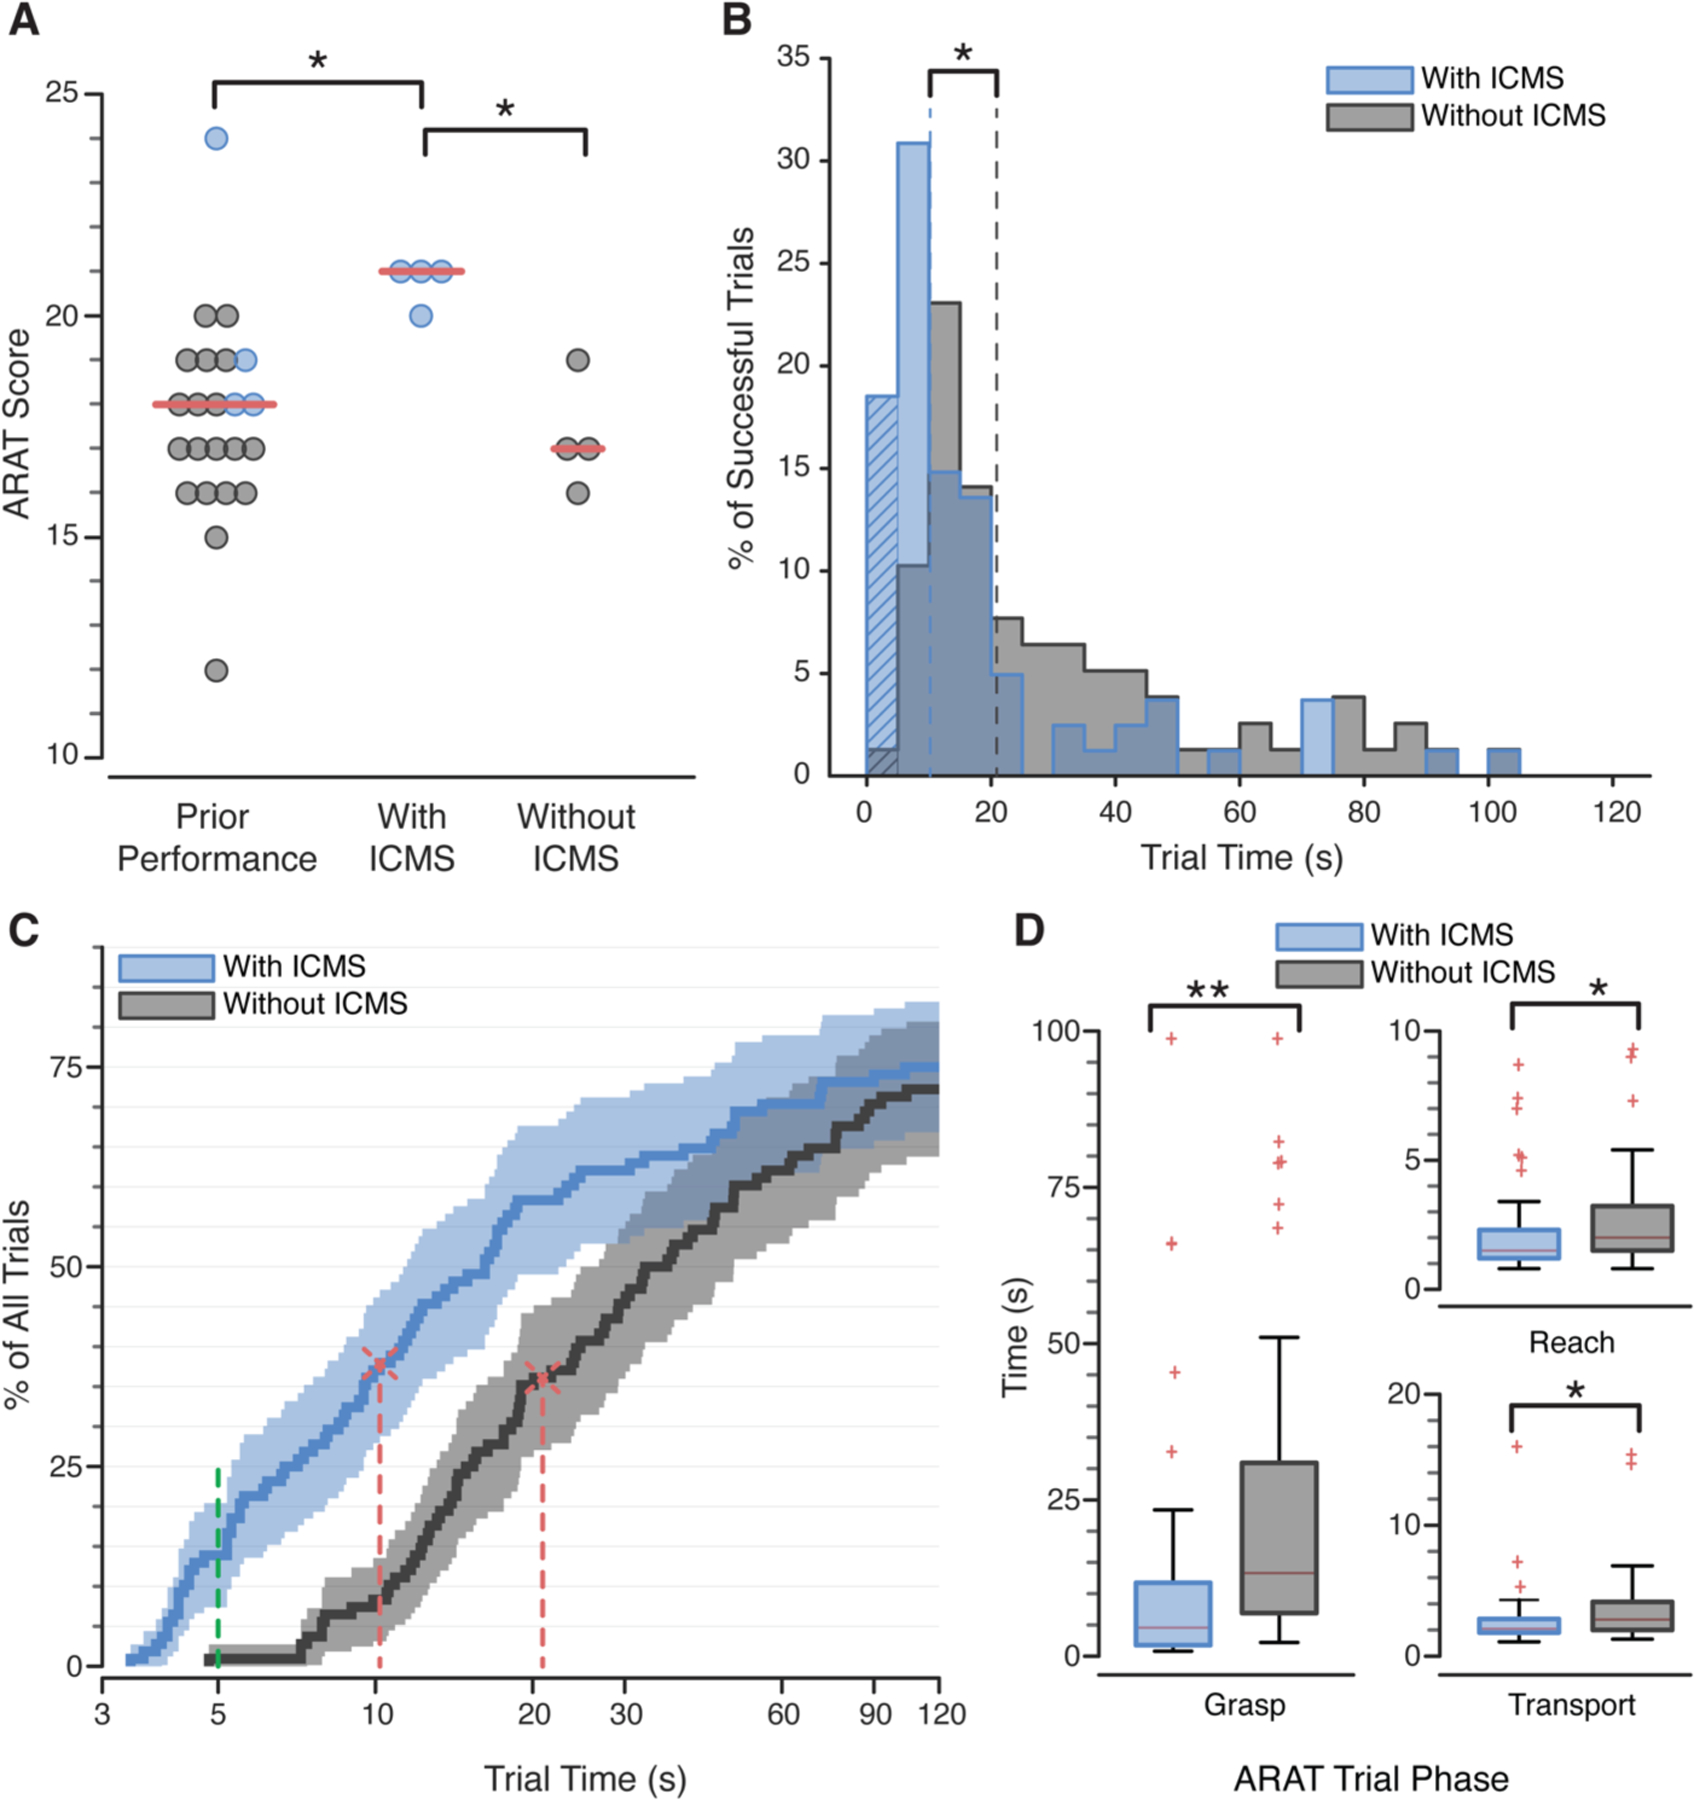
Fig. 2:

Effect of ICMS on ARAT performance. (A) ARAT scores when ICMS feedback was provided were significantly better than prior ARAT scores (*p = 0.005), which occasionally employed ICMS feedback (blue dots), and to data from the current experiment without ICMS feedback (*p = 0.029). Red lines indicate median scores. (B) Histogram of successful trial times completed with (blue) and without (gray) ICMS tactile feedback. Median trial times (dotted lines) were significantly faster with ICMS (*p < 0.0001). Hatched bars represent trials completed in under five seconds. (C) Empirical cumulative distribution of individual trial times, including failed trials, shown on a log-normalized axis. Vertical red lines indicate when 50% of successful trials were completed. Data to the left of the vertical green line represent trials completed in under five seconds. Shading indicates the 95% confidence bounds, calculated with Greenwood’s formula. (D) Amount of time spent in each phase of the ARAT task. Red lines are medians, box outlines are interquartile ranges, and whiskers are the range of the data excluding outliers (red ‘+’). All task phases were faster when ICMS feedback was provided (*p<0.001, **p<0.0001, Table S2). (A-D) Significance was assessed with a Wilcoxon rank-sum test.
