
Fig. 3:
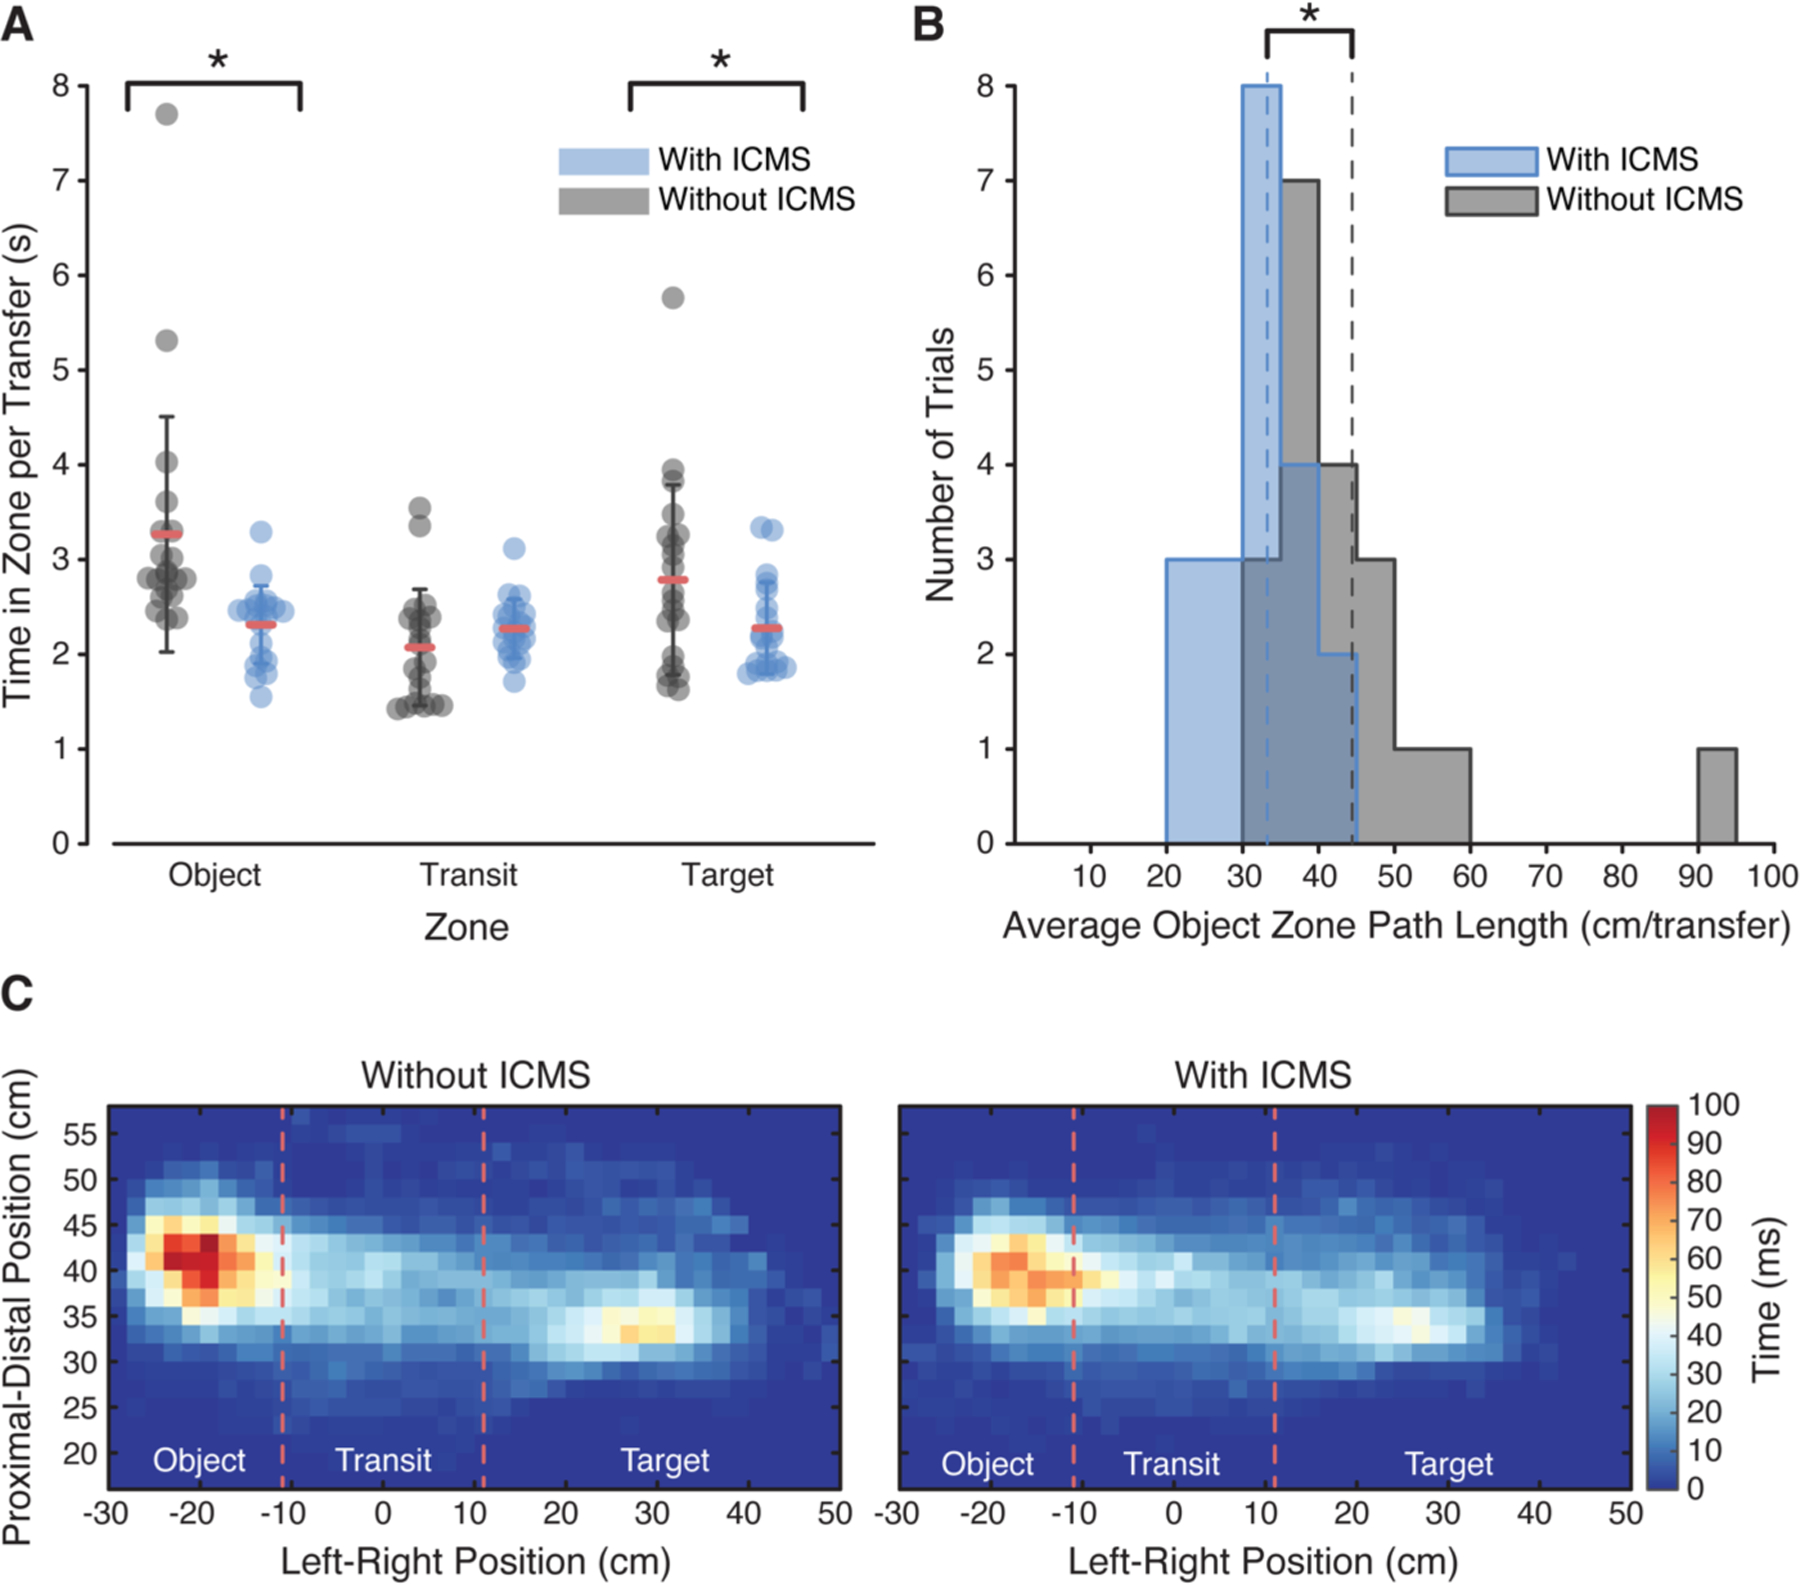
Effect of ICMS on object transfer performance. (A) Amount of time spent in each task zone, per transfer, by feedback condition (n = 20 trials per feedback condition). Data for all trials are shown with the mean value indicated by the red lines and the whiskers indicating one standard deviation. The amount of time spent in the object and target zones decreased significantly with ICMS feedback (*p = 0.002 and 0.048, t-test, respectively). (B) Distribution of average path lengths in the object zone per trial for the two feedback conditions, computed as the total path length divided by the number of transfers. Mean path length decreased with ICMS feedback (*p = 0.0007, t-test). (C) Spatial map of the average amount of time spent in each location in the workspace per transfer. Each individual square represents a 2 x 2 cm region of the workspace. The color indicates the average amount of time spent in each location per transfer. Without stimulation, more time was spent near the object in the object zone as shown by the darker red colors in the object zone. Red lines indicate zone boundaries.