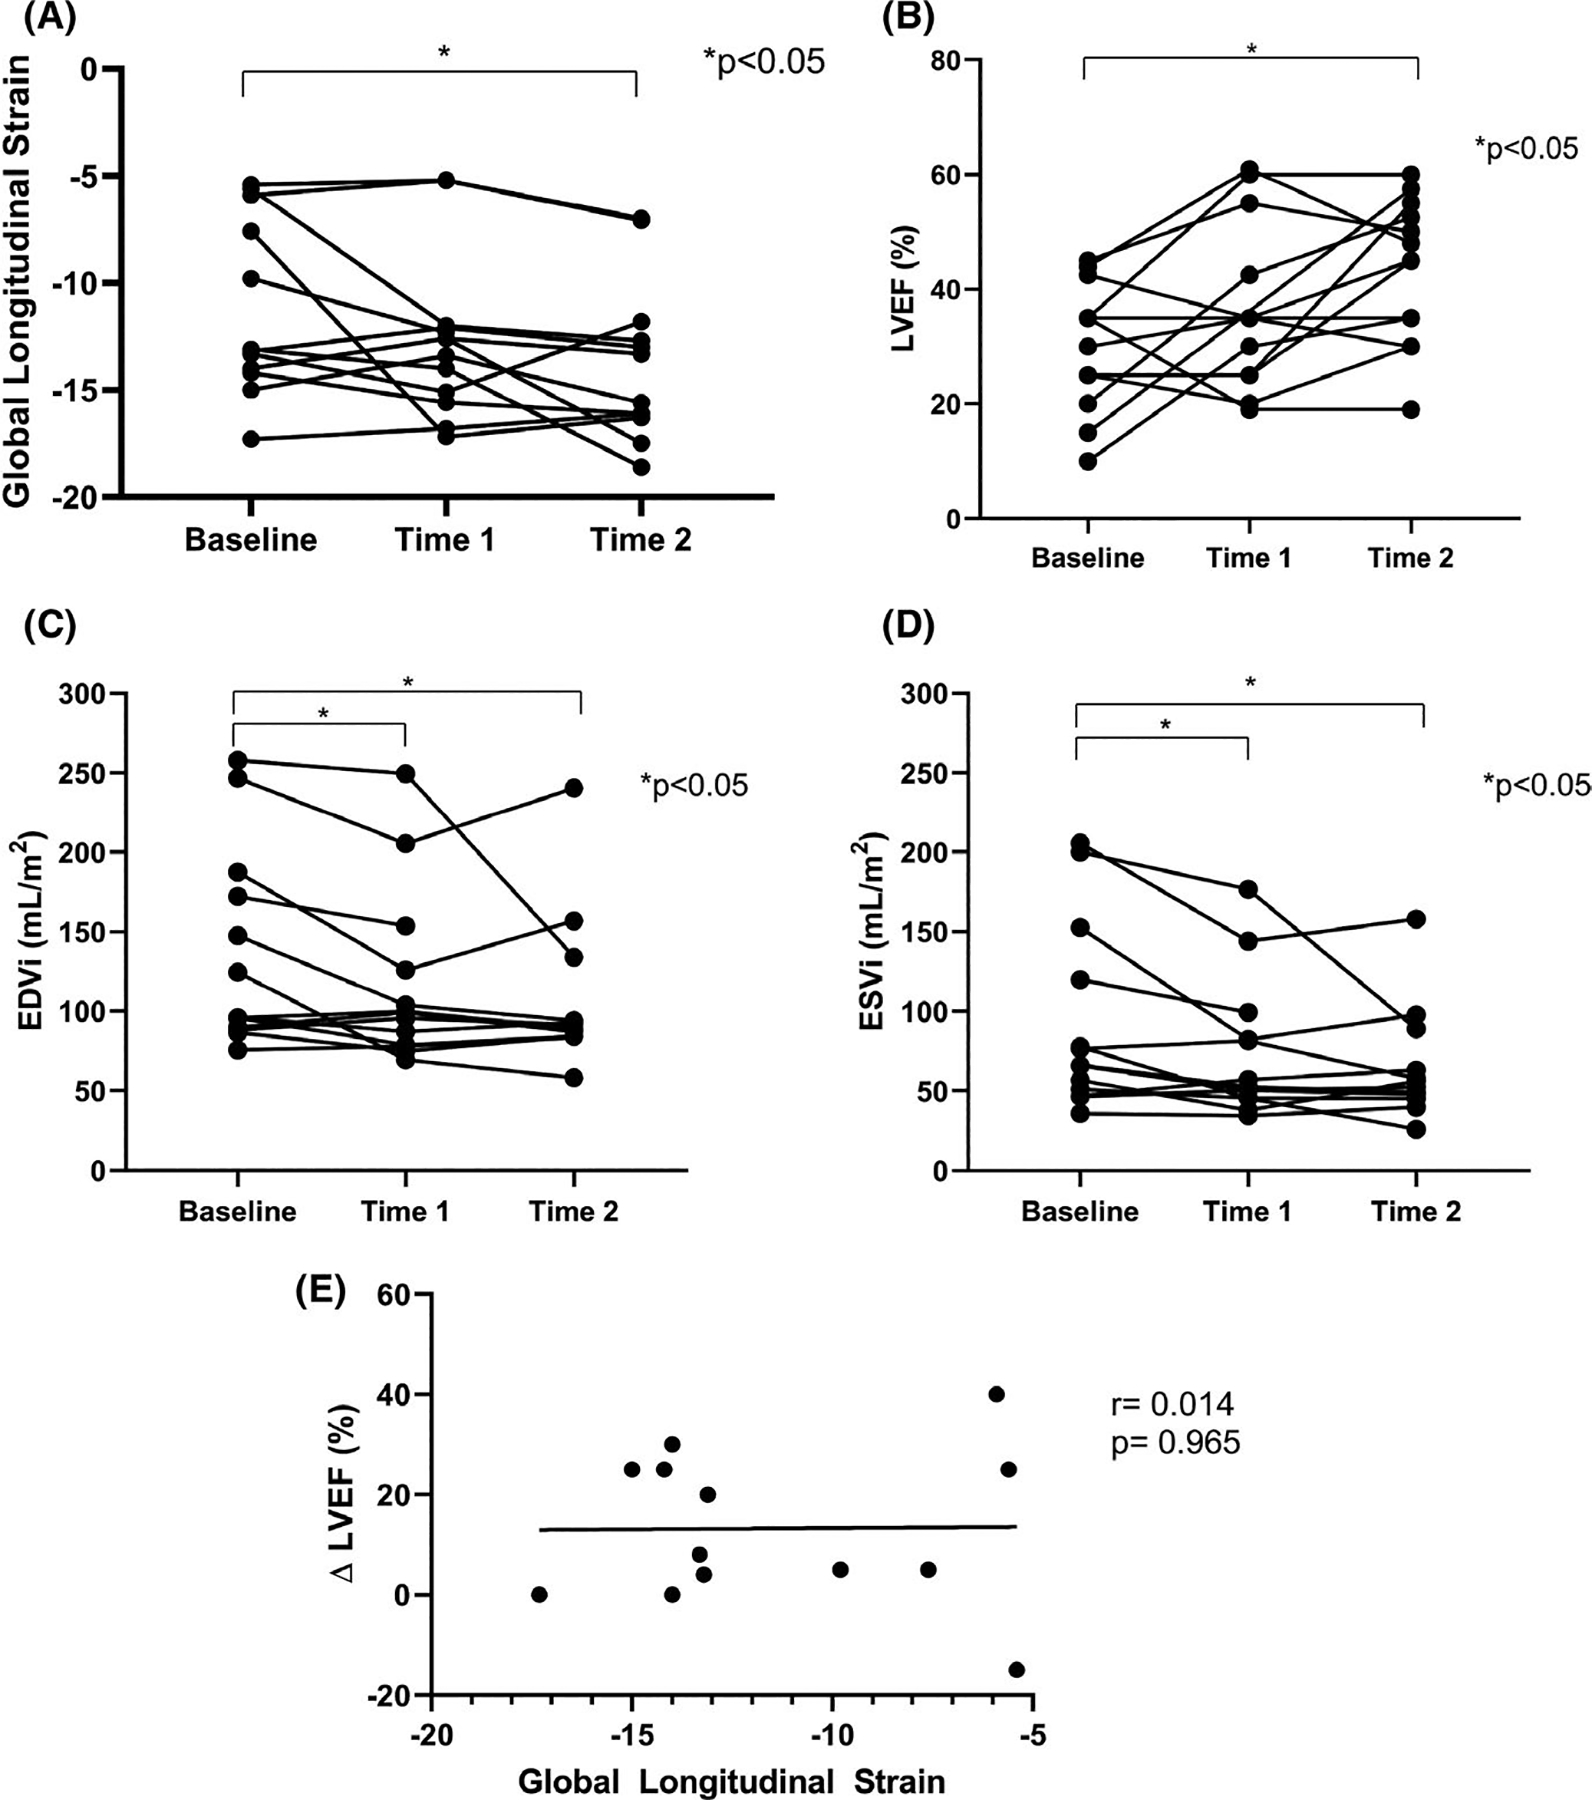
FIGURE 3.

(A) GLS at baseline, follow-up time 1 and time 2. There was a statistically significant improvement in GLS over time, but most values were indicative of persistently mild to severely reduced GLS. (B) LVEF at baseline, time 1 and time 2. There were statistically significant increases in LVEF over time. (C) EDVi at baseline, time 1 and time 2. There were statistically significant decreases in EDVi over time. (D) ESVi at baseline, time 1 and time 2. There were statistically significant decreases in ESVi over time. (E) GLS vs change (Δ) in LVEF between baseline and time 2 (2.3 ± 3.1 y). There was no major correlation between the two measures. Time 1 = 0.7 ± 1.3 y. Time 2 = 2.3 ± 3.1 y. Several participants had identical LVEF values which overlap in the figure at each time point. One participant had measures of LVEF at baseline and time 2. EDVi = end-diastolic volume index; ESVi = end-systolic volume index; GLS = global longitudinal strain; LVEF = left ventricular ejection fraction
