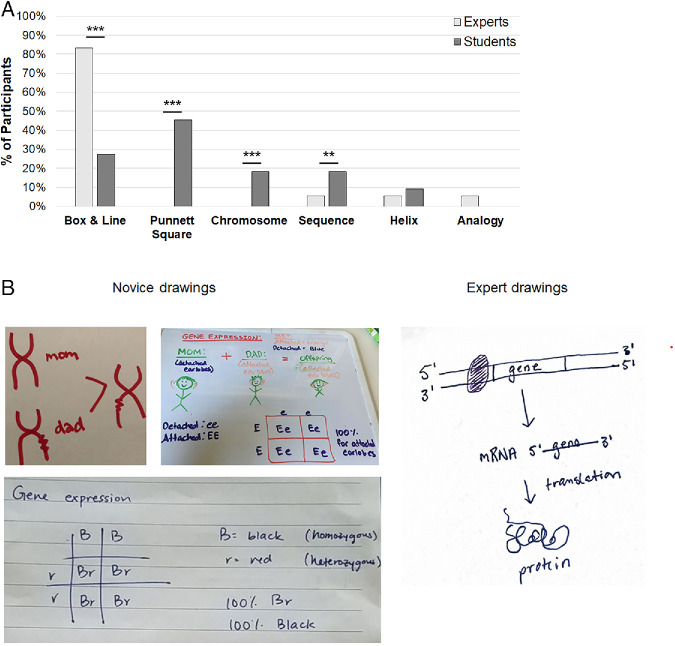
FIGURE 4.
Experts and novices used different representations when asked to draw gene expression. (A) Drawings in response to the prompt were coded according to an emergent scheme. The y-axis represents the percentage of participants who used a particular representation, as several participants used more than one category of representation in their drawing (n = 18 experts, n = 22 students). ***p < 0.001. (B) The most common representation created by experts was a box-and-line diagram outlining the basic steps of transcription and translation, while the most common representation drawn by students was a Punnett square. A chromosomal-level drawing (by a student) is also included as an example.

