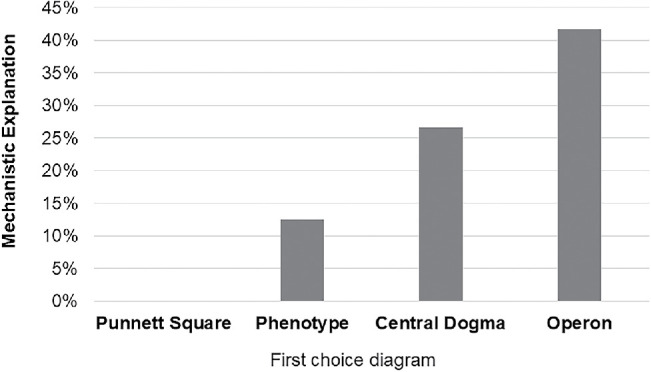
FIGURE 6.

Choice of molecular process diagrams to explain gene expression correlates with mechanistic reasoning about dominance. Students (n = 48) were asked to propose a mechanism to explain how a dominant phenotype came about. Most answers did not address the process at all, simply stating that dominant alleles are the ones that are observed in a heterozygote. However, almost all students who did propose a mechanism also chose a process-based diagram as the one that most closely resembled their mental model of “gene expression.”
