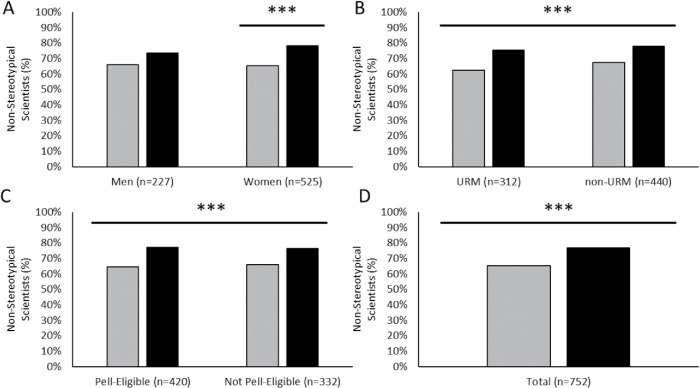
FIGURE 3.
Demographic disaggregation of nonstereotypical scientist names offered by students before and after student-authored Scientist Spotlights. Coding of students’ pre and post responses to the prompt: “Describe the types of people who do science” for those expressing nonstereotypical scientist names, disaggregated by (A) gender, (B) URM status, (C) Pell Grant–eligible status. All students are shown in D. Pre data are shown in gray; post data are shown in black. Pre–post differences are significant at ***p < 0.001 for all student subpopulations, except men.

