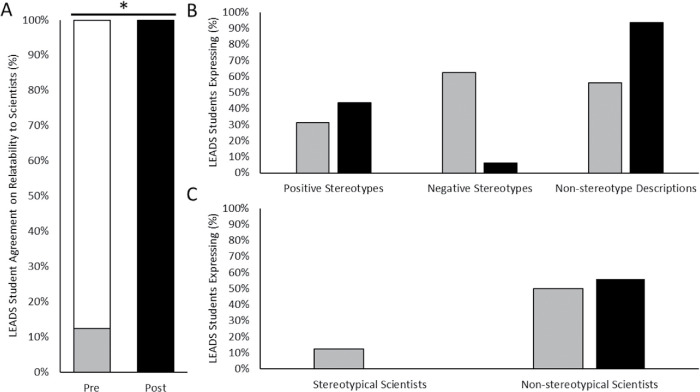
FIGURE 4.
Analyses of LEADS student authors’ assessment responses before and after authoring Scientist Spotlights themselves. LEADS students’ pre and post agreement to the prompt: “I know of one or more important scientists to whom I can relate.” For pre data, “agree” is shown in gray and “disagree” is in white; for post data, “agree” is shown in black, and there was no disagreement (A). LEADS students’ pre and post responses to the prompt: “Describe the types of people who do science” for those offering positive stereotype descriptors, negative stereotype descriptors, or nonstereotypical descriptors of scientists (B) and those offering names of stereotypical or nonstereotypical scientists (C) before and after authoring Scientist Spotlights themselves. Pre data are shown in gray; post data are shown in black. n = 16 for all panels. Pre–post differences are significant at *p < 0.05 for the relatability prompt.

